Defensives and banks lead: rotation rewards the laggards as tech pauses
Macro context
The macro backdrop stays constructive, and that matters for reading this week's rotation. Equity volatility is contained and gradually easing, the mark of a market that fears no imminent shock; fixed-income volatility has cooled sharply too, a relief for the most rate-sensitive sectors. The market-breadth gauge is improving, pointing to participation widening beyond the usual handful of names. The dollar holds steady, neither pushing nor braking.
On the commodity front the signal is the opposite and deserves attention: gold sits in critical territory, with a marked pullback over recent weeks, and oil has also given back a significant amount. It is the flip side of a less defensive financial climate, but it drains oxygen from the energy sectors. The overall reading is one of broad rotation: capital is not fleeing risk, it is shifting from what has run hard toward what had lagged. In the United States tech leadership takes a breather; in Europe the move is more diffuse and touches several sectors at once. That is the week's asymmetry — concentrated leadership slowing on this side of the Atlantic, participated rotation on the other.
US sectors
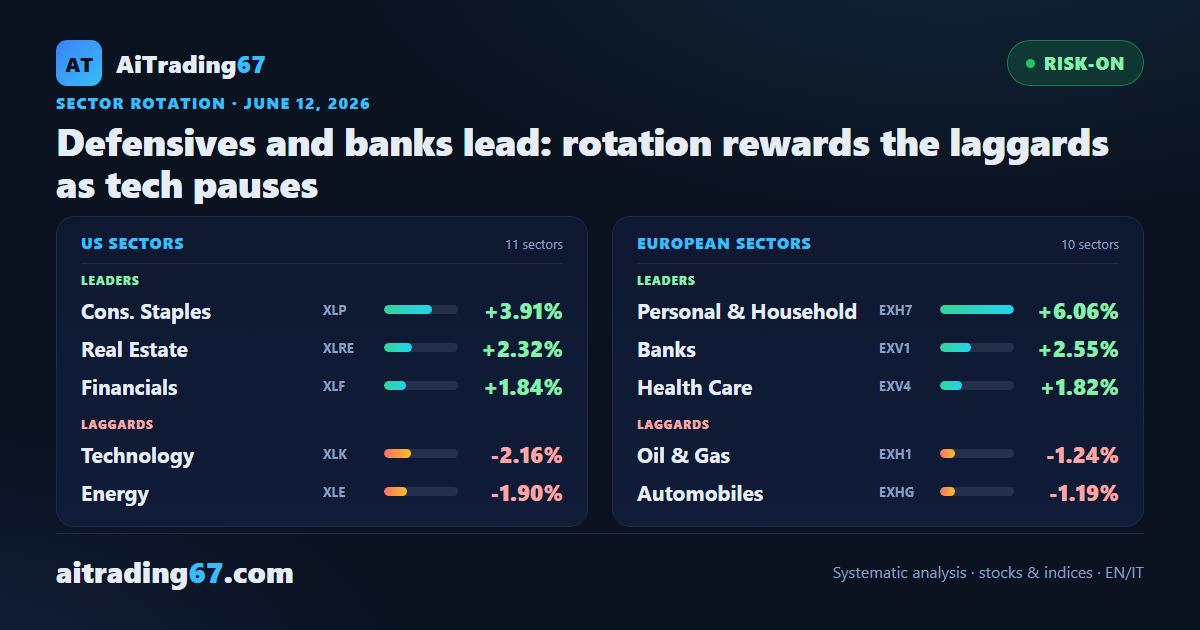
In the United States the eye-catcher is the minus sign on technology. The tech-sector ETF lost 2.16% on the week, and its momentum gauge stays weakly positive but cooling: despite strong trend strength (ADX 30.7) and an overheated RSI at 72, the thrust has run out and the sector gives ground. Communications also retreated 1.01%, with a more fragile technical picture — regime below the averages and momentum in negative territory — and energy shed 1.90%, penalized by weak oil despite one of the highest trend strengths in the basket (ADX 38.6).
At the other end of the table it is clear where the capital went. Defensive consumer staples lead with a clean +3.91%, the widest move in the entire US block, paired with momentum back in improvement. Real estate follows at +2.32%, also with a recovering structure and a regime above the averages — a sector that benefits directly from cooling rate volatility. Financials advance 1.84% in a solid frame, basic materials 1.50% and utilities 1.11%. Industrials (+0.32%) and healthcare (+0.28%) close slightly higher, while consumer discretionary lags marginally (-0.68%). The message is consistent: this week rewarded defense and rate-sensitive sectors, not growth.
European sectors
In Europe the snapshot is brighter and broader. Leading by a distance is the luxury and personal-goods sector, up 6.06%: the strongest move in the whole report, supported by sharply improving momentum that has flipped sign versus the prior week. It is a jump that alone sets the tone for a Europe where risk is sought again.
Right below, the financial and technology block holds the top of the table with substance. The sector grouping technology and financials advances 2.55% in a solid regime, with trend strength building (ADX 25.3) and an RSI at 63 that leaves room. Banks rise 1.66% with the most robust momentum on the entire European list and an RSI at 75 that tells of a convinced run — it is the continent's true structural engine. Healthcare follows at 1.82% and oil & gas at 1.59%, here supported by very high trend strength (ADX 35) that offsets weak oil. Industrials close higher by 0.93%.
On the weak side of the European table the consumer cyclicals and real estate cluster together. Autos shed 1.24% with a cooling technical frame, consumer goods give back 1.16%, telecoms 1.04% and real estate 1.19% — the latter the only sector in a regime clearly below the averages, the most fragile point of the European mosaic. A rotation that rewards finance, luxury and healthcare at the expense of the more exposed cyclicals.
Cross-region comparison & broad indices
The comparison between the two shores is sharp and tells of two different regimes. In the United States the week was a pause for the leaders: technology, which weighs heavily on broad baskets like the Nasdaq and S&P 500, lost 2.16%, and that explains why US indices struggled even amid a healthy internal rotation toward defensives and real estate. It is a rotation that protects the market from below but brakes its run from above, because the sectors rising weigh less than those falling.
In Europe the picture is the opposite and more favorable to the indices. Here strength is diffuse: luxury above 6%, financials and technology above 2%, banks and healthcare above 1.5%. Banks in particular carry a meaningful weight on the Italian market, and their resilience — momentum among the strongest, RSI at 75 — is the backbone of the MIB's good tone. The difference is all here: across the Atlantic concentrated leadership slows, on this side participation widens and supports the indices from several points at once. For anyone watching the broad baskets, the read is clear — Europe's broadly rotating indices look better supported internally than the American ones, where everything still hinges on when technology resumes leading.