How to read an analysis — Stock (buy)
How to read the post · Stock · BUY signal (uptrend)
How to read a stock analysis
The post is a sequence of cards. Here we go through them one by one: what each one shows and how to read it. We don't explain how our process works, but how to find your way around the page.
Real example used throughout this guide: AVGO (buy signal, open for 8 weeks).
Before you start — everything you read in the post are hypotheses and readings according to our model, not rules to follow. Every trader operates in full autonomy and assumes their own risk. The cards are there to help you understand, not to tell you what to do.
Section visible to everyone
Block 1
In Summary
The week's prose summary: signal status, what happened, the operational sense according to our model.
Public
Real example — AVGO
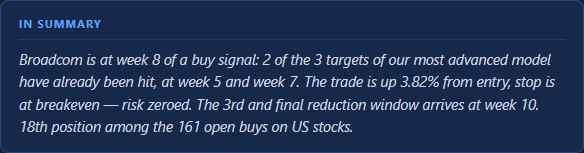
It's the starting point for reading everything else: in a few lines it tells you what state the signal is in and what the week's reading is. Every card that follows expands on this summary.
Block 2
Hero strip — the status row
The at-a-glance row at the top of the post.
Public
Real example — AVGO

From left to right: the signal status (e.g. "Open buy"), how many weeks it's been open, the category (e.g. US stocks) and the Tier (T1/T2 = editorial priority, how much room we devote to the analysis). The colour is your compass: green = uptrend scenario, red = downtrend scenario.
Block 3
KPIs — the key numbers
The five summary measures of the setup, according to our model.
Public
Real example — AVGO
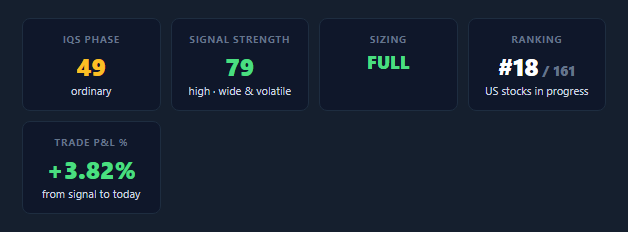
- IQS · Setup phase (0-100) — what phase the setup is in relative to its volatility norm: compressed → ordinary → stretched/mature. Descriptive, not predictive.
- Signal Strength (0-100) — on buy signals a high value = a more convincing bullish scenario; on sell signals it reads the other way around (see the dedicated block).
- Sizing — the weight the model would suggest (minimum → standard → full).
- Ranking — the stock's position within its category and signal status (e.g. #18 of 161).
- Trade P&L % — the price change from the signal to today (in %, never the price); it appears as soon as a signal is active, even in week 1 (~0%), and applies to shorts too. It is calculated with no stop loss applied: the trade is left to run, meets its targets along the way and closes only when the signal reverses. Had you exited at one of the stop levels we flag, your own result would differ.
Note — these are model reading measures, not a "buy/sell" verdict.
Block 4
The chart
The weekly chart to frame the price structure at a glance.
Public
Real example — AVGO
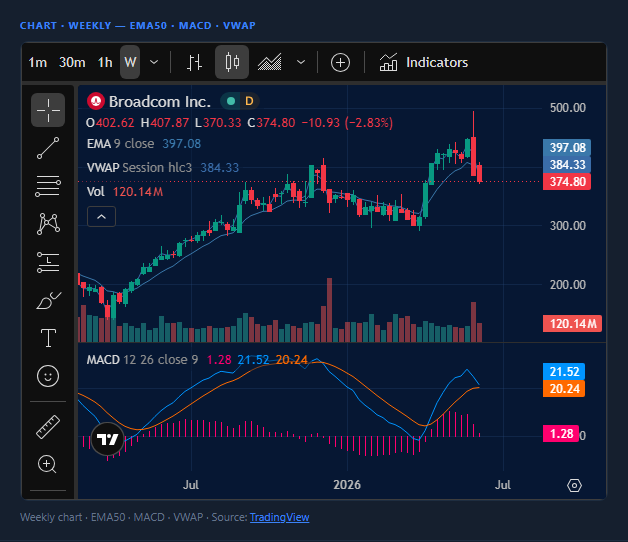
Weekly chart with three common technical references (50-period moving average, MACD, VWAP), to see "where" the price stands before going into detail. It's a TradingView widget: for some assets the chart might not be available, depending on TradingView's coverage and rules. It's the last block visible to everyone: right below you'll find the "How to read this page" link, and from here on the full analysis is reserved for Platinum clients.
Section reserved for Platinum clients
Block 5
Rank position
Where the stock sits in our category ranking.
★ Platinum
Real example — AVGO
Here you read the stock's position in the ranking, among those with the same signal type and market (e.g. 18th of 161). The order is based on Signal Strength — higher Strength, higher position — as the post's legend states. Two exceptions: for US stocks in buy the Strength is adjusted for volatility (at equal Strength, a more volatile stock ranks lower: that's the AVGO case, 18th despite Strength 79); for sell signals the ranking uses IQS instead. It remains a reading ranking, not a guarantee.
Block 6
Sector context
How the stock's home sector is doing.
★ Platinum
Real example — AVGO
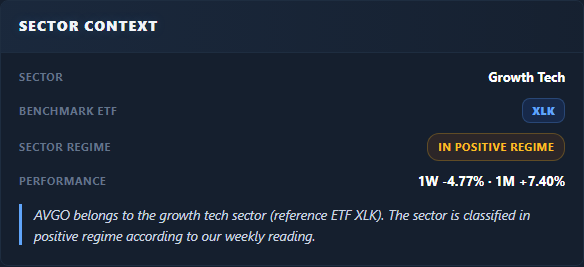
This card shows how the stock's reference sector is moving (via the sector ETF): its phase and recent performance. It's background context to frame the stock — not a filter that changes the signal.
Block 7
Confirmation week
The check on the week after the signal.
★ Platinum
Real example — AVGO
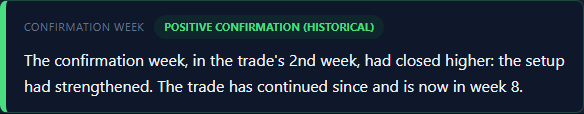
In our model a signal is always re-checked one week after it starts: the card says whether it was confirmed or it weakened. You find it in every post: on a freshly born signal it indicates that the confirmation candle is still forming; on a trade already underway it records that outcome and tells how it has progressed up to today.
Block 8
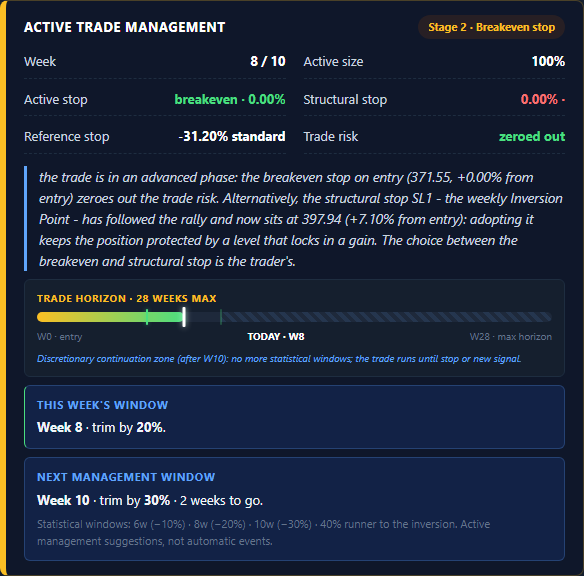
Active trade management
When the signal is already open: how the model hypothesises accompanying it week by week.
★ Platinum
Real example — AVGO
 1
2
3
4
1
2
3
4
1The stage
Top right: where the management stands. E.g. "Stage 2 · breakeven stop" = the trade is in profit and the protection is at the entry price, so in the worst case it closes at breakeven. The breakeven stop is a flagged level too: if price closes below it, we call it out just as we do for SL1 and SL2. One useful detail: the exit happens at the weekly closing price, which can sit slightly below the level — which is why the final result is often marginally negative even starting from breakeven.
2The numbers row
Week (how long it's been open), live fraction (how much of the position is still open), the three protection stops (operational/structural/reference) and the residual risk.
3The horizon
The time bar: trade duration, the TODAY point and the three trim windows (6th/8th/10th week); after the 10th a "runner" remains.
4The windows
They indicate, according to the model, when and by how much you might trim; or "coverage ended" = discretionary continuation with a stop that trails the price.
Important — these are model management hypotheses, not rules. You decide on your own, assuming the risk. This card appears when there's a bullish trade already open (even just a few weeks old). In a different situation — when the model advises against opening due to high risk — the Setup quality band appears in its place ("Trading not recommended"), with the setup grade and the alerts.
Block 9
Price Action
The "naked" reading of the price over the last few weeks.
★ Platinum
Real example — AVGO
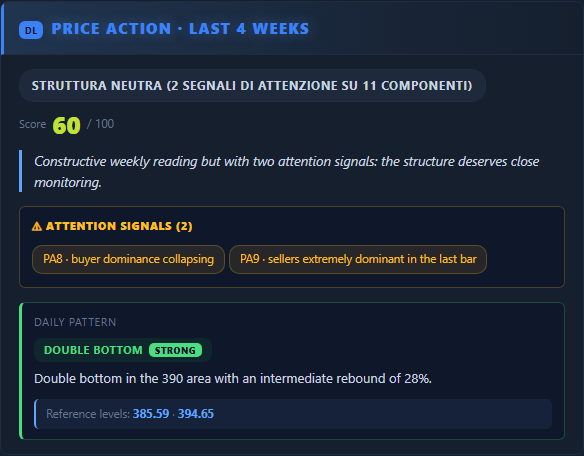
What the price is doing over the last four weeks, regardless of indicators: direction, any patterns, the strength of the move (with a summary score) and warning signs. It's the snapshot of recent behaviour, useful to confirm or scale back what the indicators say.
Blocks 10-13
The proprietary indicators
Four measures from our model, one per card.
★ Platinum
IQS · Setup phase
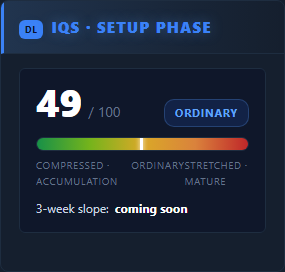
It doesn't say "buy/sell": it says what phase the setup is in (compressed → stretched/mature). It helps you tell whether the move still has room or is advanced.
Signal Strength
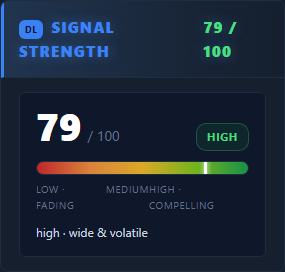
A 0-100 indicator, recomputed every week. On buy signals: high = a more convincing bullish scenario. On sell signals the opposite: high = a very strong decline, possible exhaustion rather than continuation.
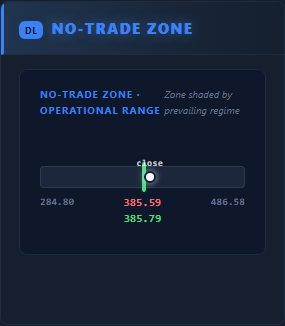
No-Trade Zone
A band around the Inversion Point where entry is not operational: inside the zone trading is suspended, entries are valid above the extreme (long) or below it (short). The dot indicates the side of the regime (not the price) and appears only once the price has left the zone; by policy we don't show the current price.
Distance from all-time highs
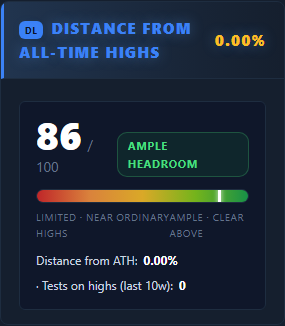
How much margin there is between the price and the all-time highs: wide margin = more potential room; narrow margin = already close to the highs.
Block 14
Operational plan
The plain-words summary of the week's setup.
★ Platinum
Real example — AVGO
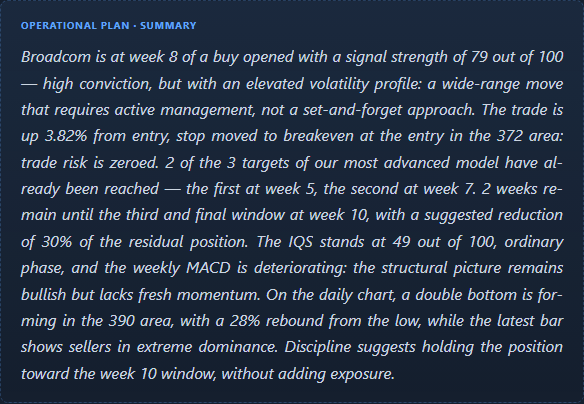
How the model hypothesises tackling the stock during the week: the operational idea told in words, holding together signal status, indicators and levels. A working hypothesis, not instructions.
Block 15
Operational levels
The trade's numeric grid: entry, protections and targets.
★ Platinum
Real example — AVGO
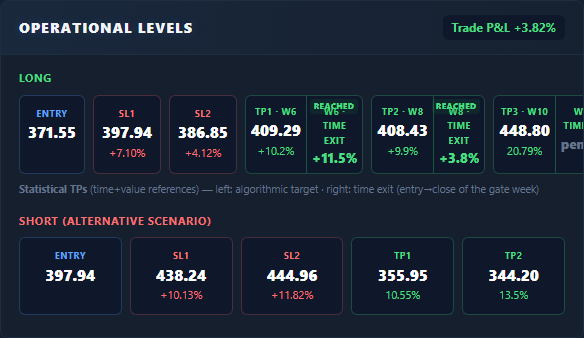 1
2
3
1
2
3
1Entry
The entry level indicated by the model.
2SL1 / SL2
The two protection stops (the second one can be omitted). They are options, not instructions: it is up to you whether to use one, which one, or none. If price closes the week beyond one of the stops flagged in the previous card we call it out in the summary and in the trading plan, along with the result anyone following that level would have taken. Only weekly closes count, not an intraweek touch. The model itself does not close the trade: it keeps tracking the stock until the signal eventually reverses.
3TP1 / TP2 / TP3
Three time+value references tied to the 6th/8th/10th week, each with its own "time yield" (the gain from entry to the close of that week). When the price touches a reference the "reached" badge appears. Below, the SHORT scenario: it's service information (the levels if the price were to reverse downward), not the primary scenario.
Important — these are model levels, not orders to execute. The wording "coverage ended" is temporal (it appears beyond the 10th week, not when the TPs are touched): from there the trade continues at discretion, with a trailing stop. The operation is yours and at your own risk.
Block 16
Previous analyses
The links to the history and to related stocks.
★ Platinum
Real example — AVGO

The links to previous analyses of the same stock (the ticker's history), in the language you're reading: they help frame the signal over time, not read it in isolation. If there aren't any yet, you'll find the link to the stock's page.
Block 17
Legend
The glossary of the page's terms.
★ Platinum
Real example — AVGO

It explains the page's terms in full. Here you'll also find the "How to read this page" link to come back to this guide at any time.