EN IT

A2A: technical rebound near double bottom, decline still intact

At week 6 of the sell signal on A2A S.p.A., the stock bounces in the 2.2 area after 3 consecutive declining weeks. Flow remains in distribution, CMF worsens: the decline holds, but the technical rebound deserves close attention.

A2A: technical rebound near double bottom, decline still intact
Sell signal · 6th week underway
A2A: technical rebound near double bottom, decline still intact
June 12, 2026
Sell signal · 6th week underway
In Summary
A2A S.p.A. is at week 6 of a sell signal: after 3 consecutive declining weeks, this week closed up 1.3%, with buy volume rising back to 76%. A double bottom in the 2.2 area is forming on the daily chart, with an intermediate rebound of 9%. However, CMF has dropped to its most negative reading of the past 4 weeks, and flow remains in distribution.
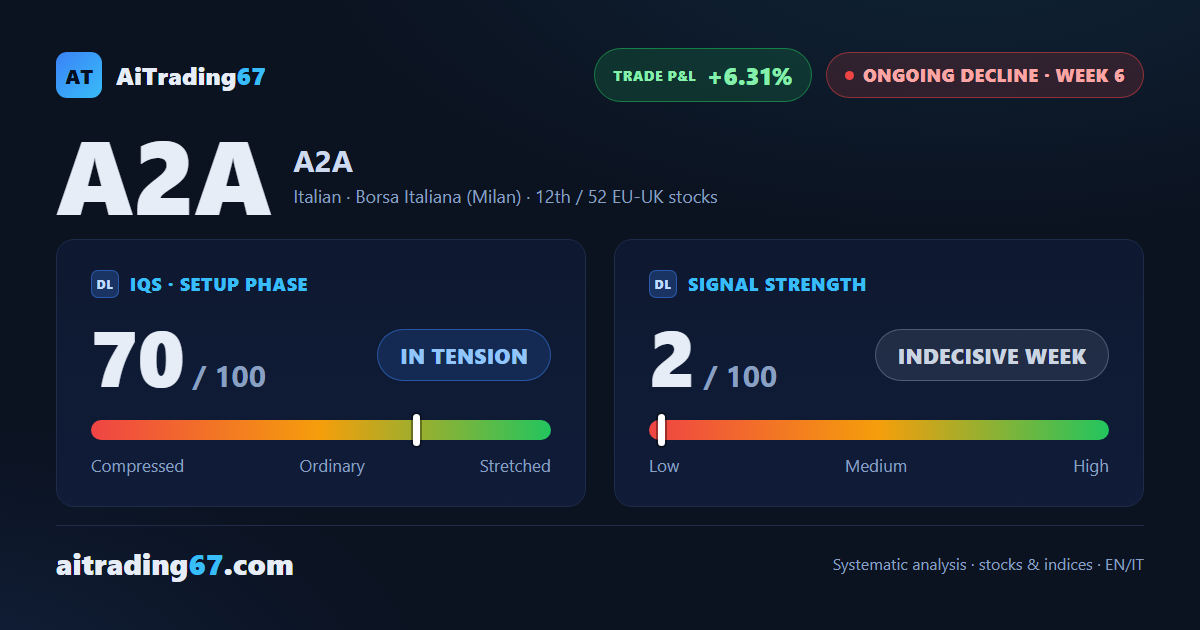
Ongoing decline ·6th week from start ·EU-UK stocks ·T2 ★ See Gold version →
IQS Phase
70
in tension
Signal Strength
2
indecisive week
Sizing
MINIMUM
Ranking
#12 / 52
EU-UK stocks
Trade P&L %
+6.31%
from signal to today
Chart · Weekly — EMA50 · MACD · VWAP
Weekly chart · EMA50 · MACD · VWAP · Source: TradingView
How to read this pageA visual guide to the post, card by card
The full analysis, operating plan and detailed levels on this asset are reserved for clients ★ PLATINUM
restricted Platinum content
Share WhatsApp Telegram Gmail LinkedIn