
A2A sell signal: the rebound stalls
A2A slips 1.5% as its Sell signal stays boxed in a tight range
A2A sell signal: the rebound stalls
Our view last week
A2A is in the 10th week of a sell signal, and this week recovered 3.0% with buying volume back at 100%. CMF has turned positive, RSI is climbing toward 51 and MACD is flattening out: technical signs of a decline running out of steam. The stock ranks 53rd among the 54 European sell signals, and the earnings date is approaching, on July 30.
This week's summary
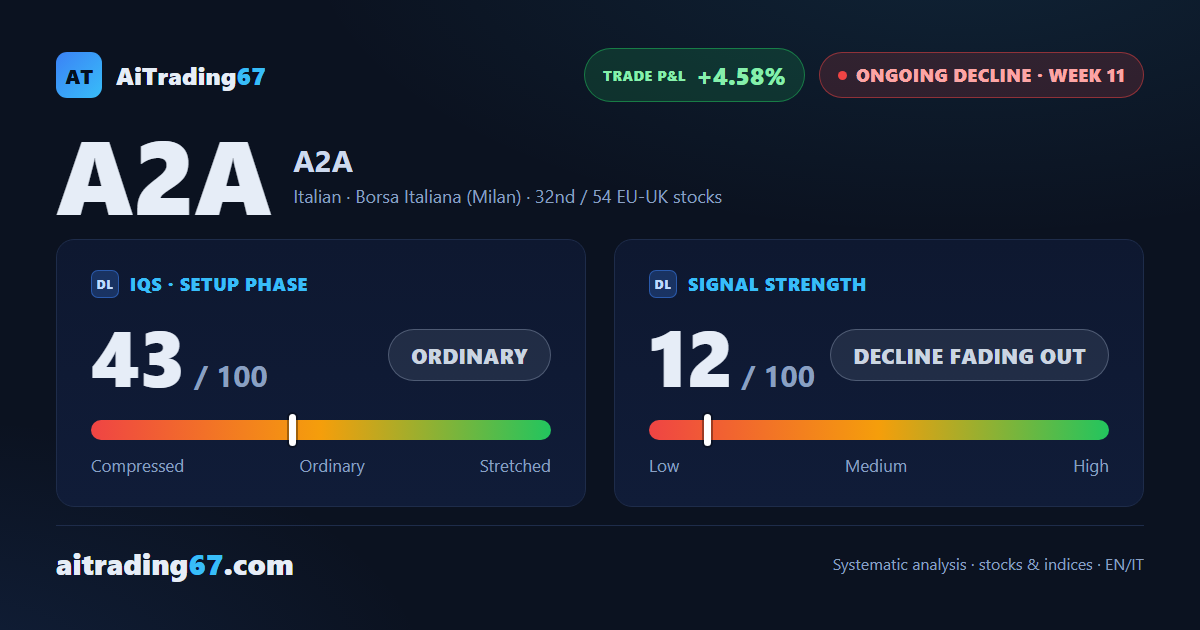
A2A's Sell signal has reached its 11th week, and this time last week's bounce has stalled: the stock slips 1.5% and sellers are back in control, with 68% of volume on the sell side. Money flow stays positive but is cooling off, and price remains boxed between the 50-week average and the 50-day average. The short is above 4% in profit: the fatigue signs spotted last week haven't found confirmation yet.
IQS Phase
43
ordinary
Signal Strength
12
decline fading out
Sizing
MINIMUM
Ranking
#32 / 54
EU-UK stocks
Trade P&L %
+4.58%
from signal to today
restricted Platinum content