
American Airlines: a technical pause in the rally
American Airlines gives back 5.4% as the rally takes a technical pause
American Airlines: a technical pause in the rally
Our view last week
American Airlines is in week 11 of a buy signal, running at +40.22% since entry. All 3 targets of our most advanced model have already been hit: coverage is complete, and the stop now trails the Inversion Point, in the 16.2 area. The stock ranks 44th among the 125 US stock buys currently open, with earnings expected in 2 weeks, on July 16.
This week's summary
American Airlines closed the week down 5.4%, with sellers back in charge at 64% of volume and money flow (CMF) cooling for a second straight week. The underlying picture still holds up: the ADX keeps climbing, a sign the trend is gaining conviction even during the pause, and price is still working inside the corridor between the 16.8 and 17.4 areas. The real change from a week ago is different: earnings, then two weeks out, now land within this very week.
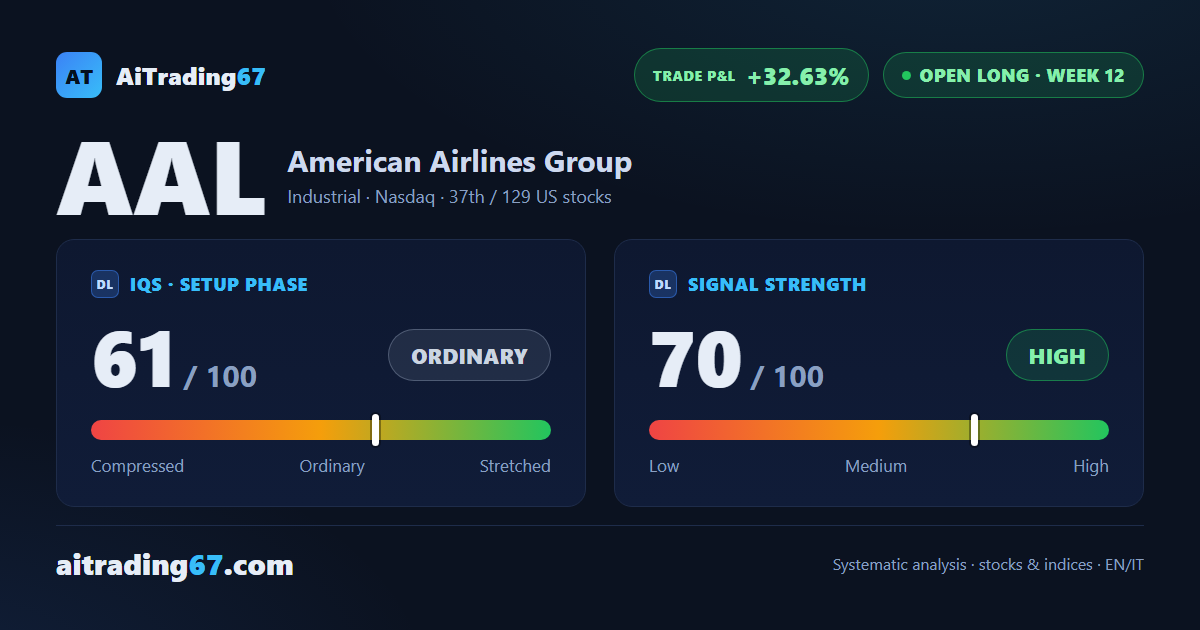
IQS Phase
61
ordinary
Signal Strength
70
high · wide & volatile
Sizing
FULL
Ranking
#37 / 129
US stocks in progress
Trade P&L %
+32.63%
from signal to today
restricted Platinum content