
Seventh week of the buy signal, near record highs
AbbVie climbs 2.6%, but buyers start to catch their breath
Seventh week of the buy signal, near record highs
Our view last week
AbbVie shares give back 5% after their run toward the highs: this week's technical analysis shows the first signs of buyer fatigue, with buying dominance collapsing and sellers in control of the last session. The underlying structure still holds — aligned trend, rising ADX — and the trade, now in week 6, is already up 13.94% since entry.
This week's summary
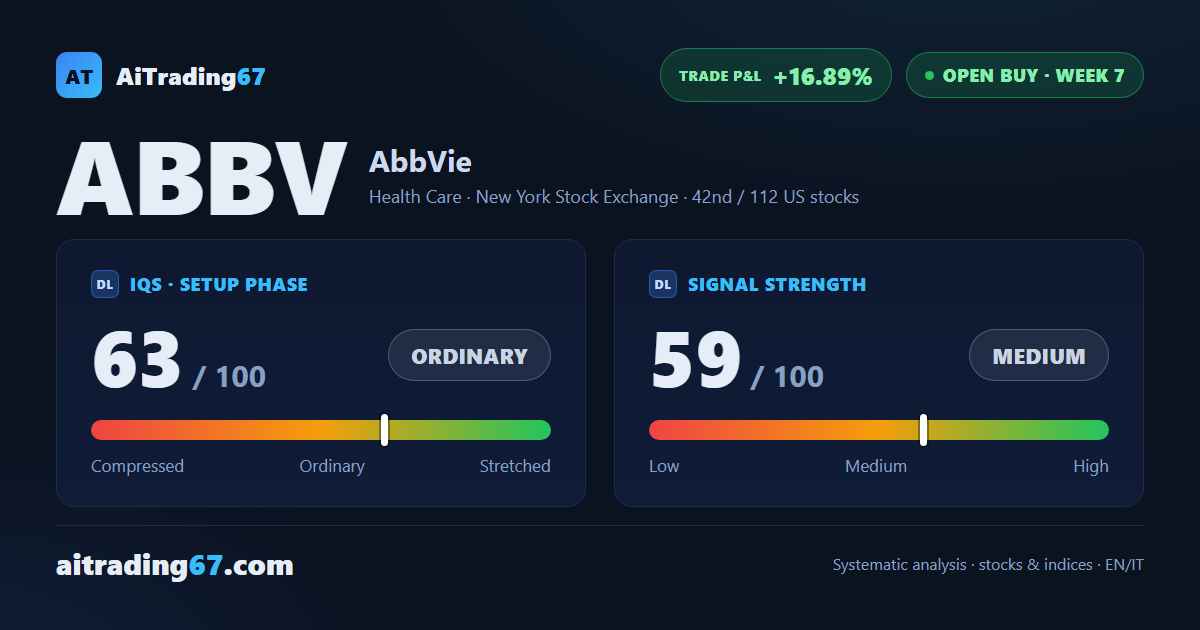
AbbVie shares bounce 2.6% after last week's pullback, but the push is already creaking: candle-body conviction is fading and buyer dominance is easing. This week's technical analysis still shows a solid picture - aligned moving averages, rising ADX - with the stock back near its all-time highs. The buy signal is in its seventh week, and the trade is up 16.89% since entry.
IQS Phase
63
ordinary
Signal Strength
59
medium
Sizing
STANDARD
Ranking
#42 / 112
US stocks in progress
Trade P&L %
+16.89%
from signal to today
restricted Platinum content