
Open long · week 18 · US stocks
AbbVie slips 0.6% after 4 weekly gains as money flow turns negative
Our view last week
AbbVie stock posts a 4th straight weekly gain, a near-flat +0.1%, and beneath the surface the tone shifts: sellers take 62% of volume after two weeks led by buyers, and the 7-day high in the 269 area keeps a lid on price near its all-time highs. In technical analysis terms, money flow stays positive and fades. The trade, one of our weekly buy signals among healthcare stocks, is running at +21.4%.
This week's summary
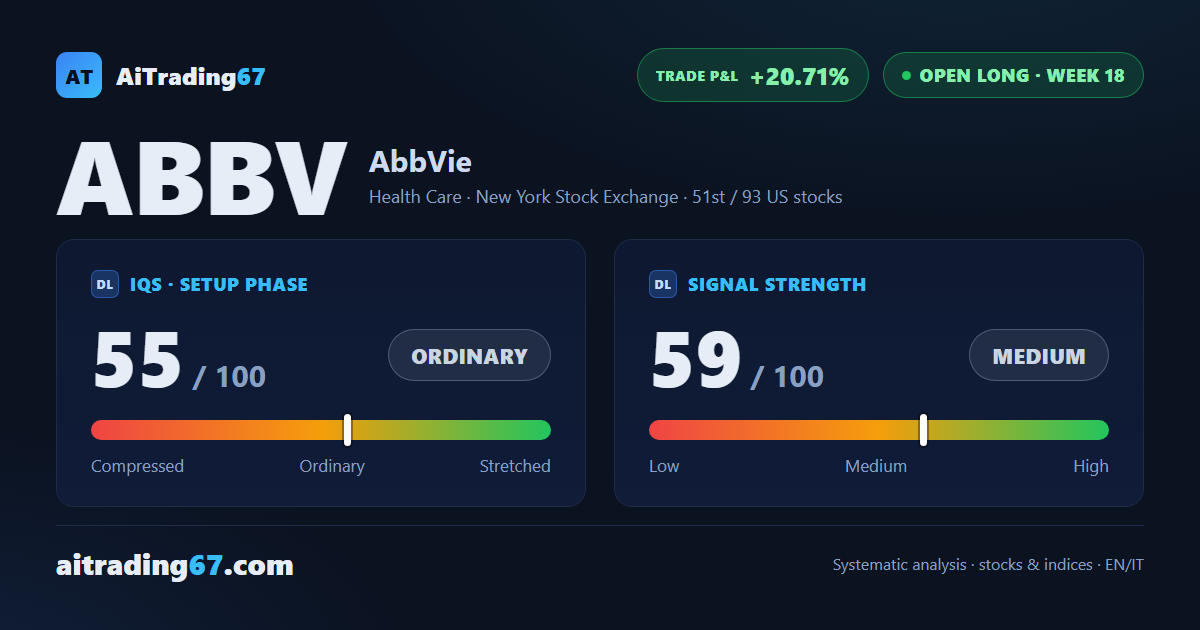
AbbVie slips 0.6% and ends a run of 4 weekly gains: the all-time high, in the 269 area, was approached again without being cleared. A week ago money flow was positive and fading, now it has dropped below zero, and the MACD histogram has narrowed for a 2nd week. For the technical analysis of AbbVie stock this is a pause inside a still orderly trend, with a bullish engulfing on the daily chart. Among our weekly buy signals on US stocks, the trade is up 20.7%.
IQS Phase
55
ordinary
Signal Strength
59
medium
Sizing
STANDARD
Ranking
#51 / 93
US stocks in progress
Trade P&L %
+20.71%
from signal to date, no stop loss
AbbVie (ABBV) weekly chart — EMA50 · MACD · VWAP
Weekly chart · EMA50 · MACD · VWAP · Source: TradingView
Rank position
ranks 51st among the 93 Longs already running for US stocks in our ranking, with a signal strength of 59 out of 100.
Sector context
SectorHealth Care
Benchmark ETFXLV
Sector regimein positive regime
Performanceweekly -2.65% · monthly -3.91%
ABBV belongs to the health care sector (reference ETF XLV). The sector is classified in positive regime according to our weekly reading.
restricted Platinum content