
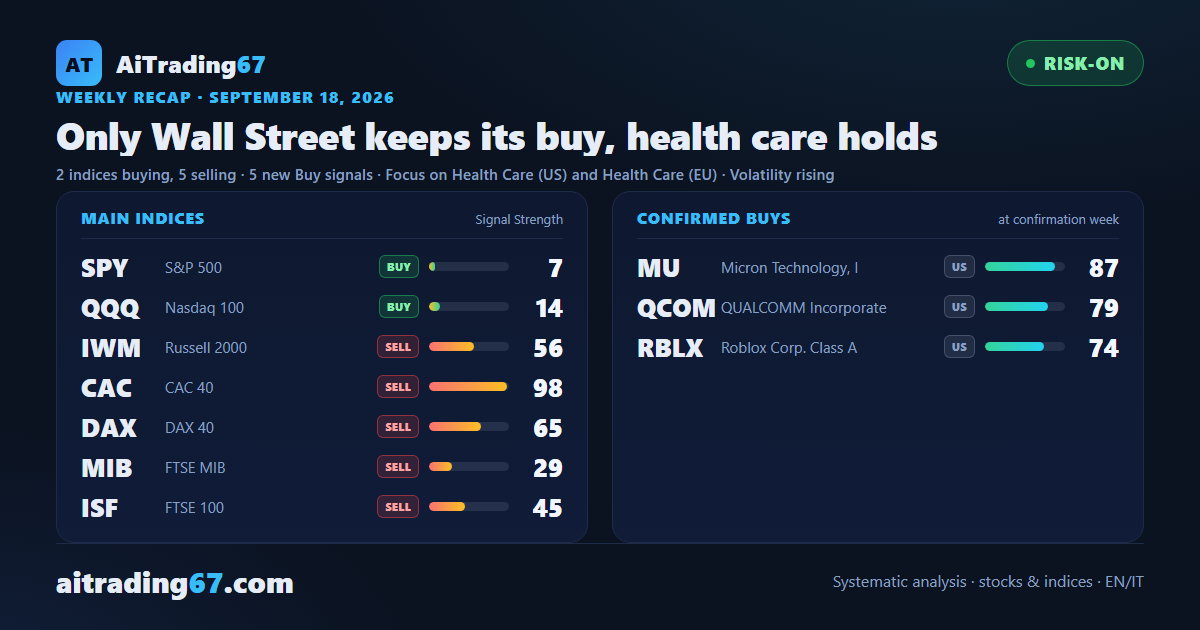
Weekly recap · September 18, 2026
Only Wall Street keeps its buy, health care holds
2 indices buying, 5 selling · 5 new Buy signals · Focus on Health Care (US) and Health Care (EU) · Volatility rising
01
The week in view
The week switched engines three times. On Monday the market dumped semiconductors and the entire power chain behind the data centers: GE Vernova gave up 8.6%, Siemens Energy 8%, Prysmian 7.1%, while money moved into cybersecurity and software. Tuesday belonged to crude, up 4.4% in a single session after a Saudi pipeline shut, with the US 10-year yield back above 5% for the first time since 2007. Wednesday the Federal Reserve raised rates by 25 basis points to 3.75-4.00%, its first hike since 2023: the S&P 500 slipped 0.44% and its weekly signal flipped to sell by a mere 0.04%. Thursday's bounce tidied everything up — Nasdaq 100 up 1.73%, equity volatility down 13% on the day — and that flip was withdrawn.
What remains is an index climbing on fewer and fewer names: breadth has fallen 38% in four weeks. At Friday's close only the S&P 500 and the Nasdaq 100 are still buyers; the Russell 2000, CAC 40, DAX, FTSE MIB and FTSE 100 all sit on the sell side.
Companies that reported this week (alphabetical, weekly change):
· FedEx Corporation (FDX) −2.7%
· MFE-MediaForEurope (MFEA) −5.5%
What remains is an index climbing on fewer and fewer names: breadth has fallen 38% in four weeks. At Friday's close only the S&P 500 and the Nasdaq 100 are still buyers; the Russell 2000, CAC 40, DAX, FTSE MIB and FTSE 100 all sit on the sell side.
Companies that reported this week (alphabetical, weekly change):
· FedEx Corporation (FDX) −2.7%
· MFE-MediaForEurope (MFEA) −5.5%
02
Macro regime
market contextRisk-On
The regime stays tradable, yet with the cost of money rising and breadth thinning for five straight weeks, selection matters more than direction.
VIX
Favorable
MOVE
Favorable
DXY
Neutral
Breadth
Under pressure
03
Main indices
7 Broad ETFsThe index picture has split along the Atlantic: only the S&P 500 and the Nasdaq 100 close the week as buyers, and both do it with the thinnest of pushes left. The other five are on sell, yet their conviction could hardly be further apart: the CAC 40 carries signal strength near its ceiling, the FTSE MIB the lowest reading in the group. The DAX and the FTSE 100 turned this week, and they are the two to look at first.
State Street SPDR S&P 500 ETF (SPY)Buy · open›
The S&P 500 is the index that risked the most and ended up holding. On Wednesday, after the Federal Reserve decision, its weekly signal flipped to sell by a bare 0.04%; Thursday's rebound pulled it back to the right side and the flip was withdrawn. The buy stays open in week 23 and is worth +12.1% since entry, but the push is down to a trickle: signal strength reads 7 out of 100 and the MACD histogram sits below zero. The week closes nearly flat, down 0.3%, with the index 2.3% below its own record.
Signal Strength7 / 100
Invesco QQQ Trust Series I (QQQ)Buy · open›
The Nasdaq 100 is the only index closing the week in the green, up 0.9%, and it does so after living through Monday's semiconductor crash and Thursday's rebound. It is the portrait of a technology sector split in two: chips dumped and then bought back, software and cybersecurity accumulated all week long. The buy is in its fifth week and still runs 1.3% below entry, with signal strength at 14 out of 100 and the index 3.6% below its highs. A young signal that still has something to prove.
Signal Strength14 / 100
iShares Russell 2000 ETF (IWM)Sell›
The Russell 2000, the US small-cap index, stays on the sell side and the week takes another 1.7% off it, the widest drop among the US indices. Signal strength at 56 out of 100 places it halfway: the decline has structure, though not the conviction of the European cases. Relative strength slips to 49.5, the MACD histogram sits below zero and the gap from the highs widens to 6.9%. For small caps, a rising cost of money is about the most direct headwind there is.
Signal Strength56 / 100
Multi Units France Sicav (CAC)Sell›
The CAC 40 carries the highest conviction in the whole group: signal strength reads 98 out of 100, effectively at the ceiling, and the sell signal reaches its third week. The week gives up 1.2% and the index sits 7.6% below its own record, with relative strength down to 44.4 and the MACD histogram under zero. It is the most orderly decline in the European basket, the one where structure and momentum say the same thing — which is exactly why our model advises against chasing it now.
Signal Strength98 / 100
Amundi DAX II UCITS ETF Acc (DAX)Sell›
The German basket is the week's new entry: its sell signal has fired right now, with price closing below the 20-week average after leaning on it for months. The MACD crossed below its line after 17 weeks above, and in the weekly bar buying fell under a quarter of volume. The week ends 1.0% lower and the index sits 4.9% below its high. Signal strength at 65 out of 100 says the move has width, but this is week one: the quality band advises against opening here.
Signal Strength65 / 100
Amundi FTSE MIB UCITS ETF (MIB)Sell›
The FTSE MIB is in week two of its sell signal, and with the lowest conviction in the group: signal strength stops at 29 out of 100. The week sheds 1.8%, the widest fall of the seven, yet relative strength stays the highest among the European indices at 56.5, and the distance from the record is 4.8%. It is the portrait of a market drifting lower without momentum, in a month when Milan has often taken rate news better than its neighbours. A decline to verify rather than to follow.
Signal Strength29 / 100
iShares Core FTSE 100 UCITS ETF (ISF)Sell›
The FTSE 100 turns to sell this week and is, of the seven, the index furthest from its own highs: 9.8% below. The weekly fall is modest, down 0.9%, and relative strength stays mid-range at 51.9, with the MACD histogram under zero. Signal strength at 45 out of 100 describes a decline with no particular conviction, barely opened. London was the calmest venue of the week, and that is precisely why this flip deserves a check at the next weekly close before drawing conclusions.
Signal Strength45 / 100
04
Sector rotation
US · EuropeHealth care is the only sector rising on both sides of the Atlantic: up 3.04% in Europe, 1.83% in the United States. This is the same health care that two weeks ago was the most discarded corner of the market, and the return of capital to it tells the week better than any index does. In the US, technology takes second place (+1.03%), recovering only in the final session what it had lost on Monday. At the bottom the defensive logic runs backwards: US utilities at −3.04%, European basic resources at −2.62% and US financials at −2.43%, hit by the very rate decision that was supposed to help them. The full rotation, sector by sector and across both regions, sits in this week's ETF sector report, published the same day.
US sectors
XLV›
State Street Health Care Selec
rising · +1.83%
XLK›
State Street Technology Select
rising · +1.03%
XLP›
State Street Consumer Staples
falling · -0.70%
XLE›
State Street Energy Select Sec
falling · -1.27%
XLI›
State Street Industrial Select
falling · -1.52%
XLC›
State Street Communication Ser
falling · -1.59%
XLRE›
State Street Real Estate Selec
falling · -2.05%
XLF›
State Street Financial Select
falling · -2.43%
XLU›
State Street Utilities Select
falling · -3.04%
European sectors
EXV4›
iShares STOXX Europe 600 Healt
rising · +3.04%
EXH9›
iShares STOXX Europe 600 Utili
rising · +0.58%
EXH4›
iShares STOXX Europe 600 Indus
falling · -0.41%
EXH1›
iShares STOXX Europe 600 Oil &
falling · -0.55%
EXV3›
iShares STOXX Europe 600 Techn
falling · -0.55%
EXV1›
iShares STOXX Europe 600 Banks
falling · -2.25%
EXV6›
iShares STOXX Europe 600 Basic
falling · -2.62%
05
Confirmed Buy signals
at the confirmation weekSeven buys that started last week cleared their confirmation week by closing higher, and the geography already tells you something: five are American, two Brazilian, none European. Confirmation matters because the second week is a signal's first real test, and this time it ran straight through the day of the rate hike. The American signature is technological and volatile: Micron leads with the group's highest strength, followed by Qualcomm, bought back by the market right after Monday's semiconductor crash, then Roblox, GameStop and Meta, the only one of the seven carrying company news. From Brazil come Sabesp, a water utility, and Gerdau, a steelmaker. That Europe scores zero, in the week four of its indices sit on sell, is consistent: confirmation never came there because fresh signals barely existed. Worth opening the individual cards before drawing conclusions.
1
MU
Micron Technology, Inc.
Strength 87
›
2
QCOM
QUALCOMM Incorporated
Strength 79
›
3
RBLX
Roblox Corp. Class A
Strength 74
›
4
GME
GameStop Corp. Class A
Strength 70
›
5
META
Meta Platforms Inc Class A
Strength 66
›
None this week
1SBSP3
Companhia de Saneamento Basico do Estado de Sao Paulo SABESP
Strength 66
›
2
GGBR4
Gerdau S.A. Pfd
Strength 59
›
06
Ranker rankings
Top by Signal StrengthJust three fresh US buys, and all three ask for patience rather than enthusiasm. MARA Holdings leads, jumping 10.5% and stalling right below its 7-day high: that line is what switches the signal on, and the close has yet to clear it. It arrives off a 23% bounce on the 20-day average and three weeks of buyers, but the price action is wide and our model rates the opening high-risk. Virgin Galactic follows, up 5.1% on the week with the MACD back above its signal line after 10 weeks below, even though buyers took barely a third of daily volume. Apple rounds out the trio: a fifth straight weekly gain, up 1.2%, with the histogram rising for a month — yet it trades less than 3% below its all-time high, and mixed rejection candles argue for a measured entry. Three fresh signals, none of them worth chasing.
One hundred and sixteen US buys are still open, and the top of the table reads like a manual on management. Fortinet surges 8.8% on the week with buyers at 61% of volume and four higher lows on the daily chart: the trade is now running above 96% since entry. Zscaler does even better over the week, up 19.9%, with price action that shows not a single warning flag and a 30.5% gain — the face of the move into cybersecurity that ran through the whole week. Snowflake takes the tape back from sellers after two weeks and adds 1%, though a relative strength reading of 73 keeps it in overbought while the trade already sits at +93%. Oscar Health, up 122%, sees its MACD slip below its signal line for the first time in 22 weeks. And Dell pauses after two weeks of +14.9% and +8.2%, with the trade at +283%. For anyone in stock trading, the job on these names is not opening — it is defending what is already there.
The sell side is where this week's news lives: 39 fresh signals, and the names at the top all carry maximum signal strength. Constellation Energy drops 10.5% with sellers extremely dominant and money flow turning negative — seven days ago it was a buy losing its grip, now it heads the 155 US sell signals. Fiserv sheds 8.5% and closes just above its 90-day low, with buying below a quarter of volume. SLB gives up 8.8% in the very week crude ran: the producers have stopped following the commodity. Alongside the fresh ones sit the mature declines: Opendoor closes its fifth straight down week with 89% of trading on the sell side and the short more than 43% in profit, while the US industrials ETF marks week four of its signal with an orderly 1.5% slide. These are cases to study, not to chase from cold.
Europe produces only two fresh buys, and it produces them in the week its main index flips to sell: that alone says how narrow the selection has become. Tesco closes up 2.3% and turns the picture around after five weeks of a sell signal, yet sellers kept the edge in the weekly bar and the trend indicator has been falling for seven weeks — an entry to size carefully, not to fill. INWIT pauses after three up weeks, down 0.2%, and here too the news is the change of sign: the sell has closed and the buy has fired. The MACD has been above its line for nine weeks, but money flow has been negative for sixteen, and the trigger only counts above the 7-day high. Two defensive names — food retail and telecom towers — worth a look precisely because they look nothing like the rest of the board.
Fifty-three European buys stay open while the continent's indices flip to sell, and the contrast is worth a moment. SAP leads, recovering 3.3% after two down weeks and holding +16% since entry — yet sellers keep the edge in the weekly bar for a third consecutive time, and money flow, still positive, keeps cooling. Capgemini bounces 1.4% after the previous week's 3.3% drop, with buying still under a quarter of volume. Bayer is the one that changes most: the MACD crosses below its line after eleven weeks and sellers reach 83% of the flow, trimming the trade to +2.3%. Fincantieri closes almost flat but bounces 2% off its 20-day average, up 7.4% since entry, and Eni reaches week eight at +4.3%, carving higher lows on the daily chart. Mature positions, to be walked forward name by name.
Sixty-five European sell signals are still live, and the top of the ranking describes an orderly decline rather than a rout. Saint-Gobain sheds 3.4% and stretches its losing run to six straight weeks, with four lower highs on the daily chart and signal strength at its ceiling: the most regular slide of the group. Buzzi closes a third red week, down 4.1%, with 93% of volume on the sell side against 82% seven days earlier, and the short 14.7% in profit. Moncler gives up 3.2% as 88% of trading goes to sellers — the most extreme reading of the month — with the signal under management for 27 weeks and close to 17% in profit. Air Liquide falls 2% in a second down week, and Stellantis drops 10% just two weeks after a bar in which buyers held 93% of the volume: that short is beyond 28%. Positions to monitor, not entries to hunt here.
Twenty-one open positions in the rest of the world, all Brazilian, and the week split them in two. On the hard side, Companhia Siderurgica Nacional drops 12.2% and ends a run of four weekly gains, with sellers extremely dominant and money flow below zero: the signal still tops its ranking, but the price action points to distribution. MRV Engenharia loses 8.9% and watches the trade's gain all but vanish, while Usiminas sheds 6.5% and draws an early-exit warning from the model. On the other side, Cyrela climbs 2.7% carving four higher lows on the daily chart, with the trade at +15.9%, and Light closes down 4% yet bounces 4% off its 20-day average, up 12% since entry. Steel struggling, construction and utilities holding: a block to read name by name, never as one.
1
CSNA3
Companhia Siderurgica Nacional
Strength 86
›
2
MRVE3
MRV Engenharia e Participacoes S.A.
Strength 83
›
3
CYRE3
Cyrela Brazil Realty SA Empreendimentos e Participacoes
Strength 74
›
4
LIGT3
Light S.A.
Strength 74
›
5
USIM5
Usinas Siderurgicas de Minas Gerais SA-Usiminas Pfd A
Strength 74
›
See all 21 →
Nine sell signals in the rest of the world, and nearly all of them describe a decline losing speed. The exception is Braskem, down 16.3% after pushing up to its Inversion Point and getting turned back there: seven days ago buyers held 75% of volume, now 96% of trading is on the sell side and the short is closing in on 50% in profit. The other four run the opposite way. Cosan sheds 1.4% yet sees volume switch sides, with 68% of trading going to buyers after 97% on the sell side a week earlier, and the short still down 10.3%. Ambev loses 1.5% with sellers at 86%, Lojas Renner 1.4% for a second week with the short beyond 15%, and Even Construtora closes a fourth down week on a shorter body as sellers ease from 97% to 68%. Mature declines, better watched than opened.
Methodology note — Nothing written here constitutes financial advice, a solicitation to buy or sell financial instruments, or any kind of recommendation. Past performance is not indicative of future results. Trading involves significant risk of loss; the user acts under their own responsibility. Signal Strength is an internal analytical framework used only to rank relative technical quality within the basket. © Fabio Gentili.