
Airbnb, third week of the buy signal
Airbnb slips 1.8% but the buy signal holds firm in its third week
Airbnb, third week of the buy signal
Our view last week
Airbnb shares closed the week almost flat, -0.2%, but the technical picture stays lively underneath: the daily chart carved out a double bottom in the 128 area with an 8% rebound, and the price is now boxed into a tight band between the 148 and 150 areas, a step away from its recent highs. The buy signal is in its second week, with the first confirmation closing positive: the setup quality indicator climbs to 73 out of 100, in tension, while signal strength holds medium, 55 out of 100.
This week's summary
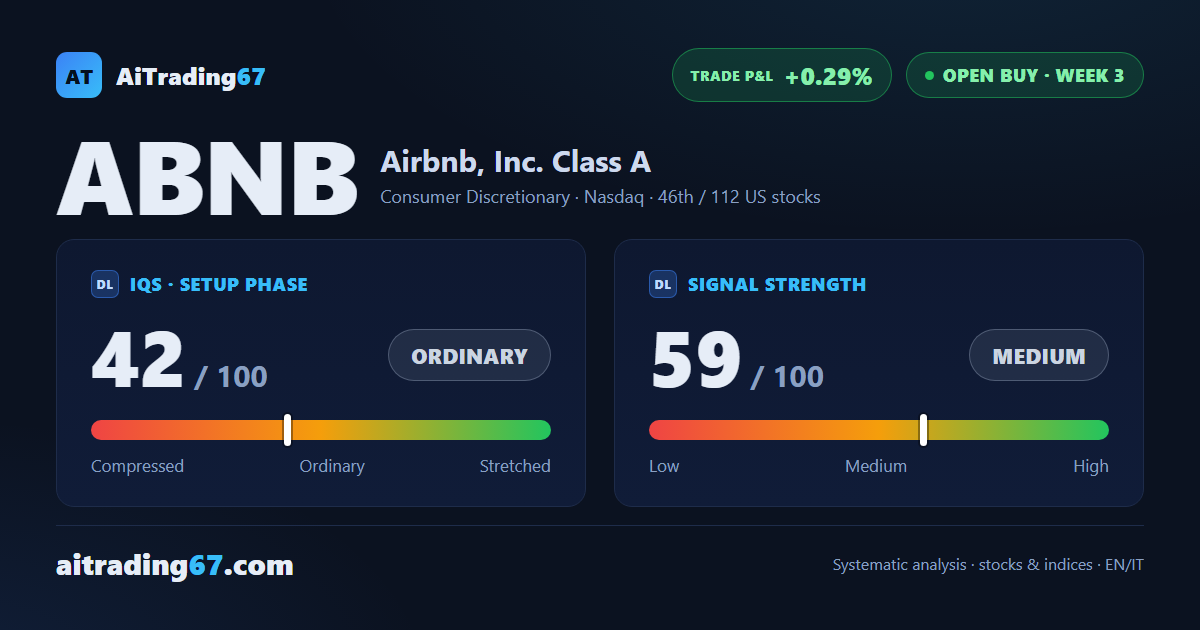
Airbnb's setup quality indicator has cooled fast, dropping from 73 to a more sober 42 out of 100, while the stock slips 1.8% and stays boxed between the 145 and 151 areas, right under its highs. The first confirmation week still closes positive. Airbnb is a case worth watching closely: the highs have been tested multiple times, and the data call for waiting on a pullback before a fresh entry.
IQS Phase
42
ordinary
Signal Strength
59
medium
Sizing
STANDARD
Ranking
#46 / 112
US stocks in progress
Trade P&L %
+0.29%
from signal to today
restricted Platinum content