EN IT

Abbott Laboratories: decline holds, but momentum is fading

Abbott Laboratories weekly technical analysis — week 13 of a sell signal, +16% performance since inception. The latest week closed nearly flat, but with 82% seller dominance and ongoing distribution. Key development: MACD histogram narrowing and momentum recovery from late-May lows, a trad

Abbott Laboratories: decline holds, but momentum is fading
Abbott · Week 13 of the decline
Abbott Laboratories: decline holds, but momentum is fading
June 19, 2026
Abbott · Week 13 of the decline
In Summary
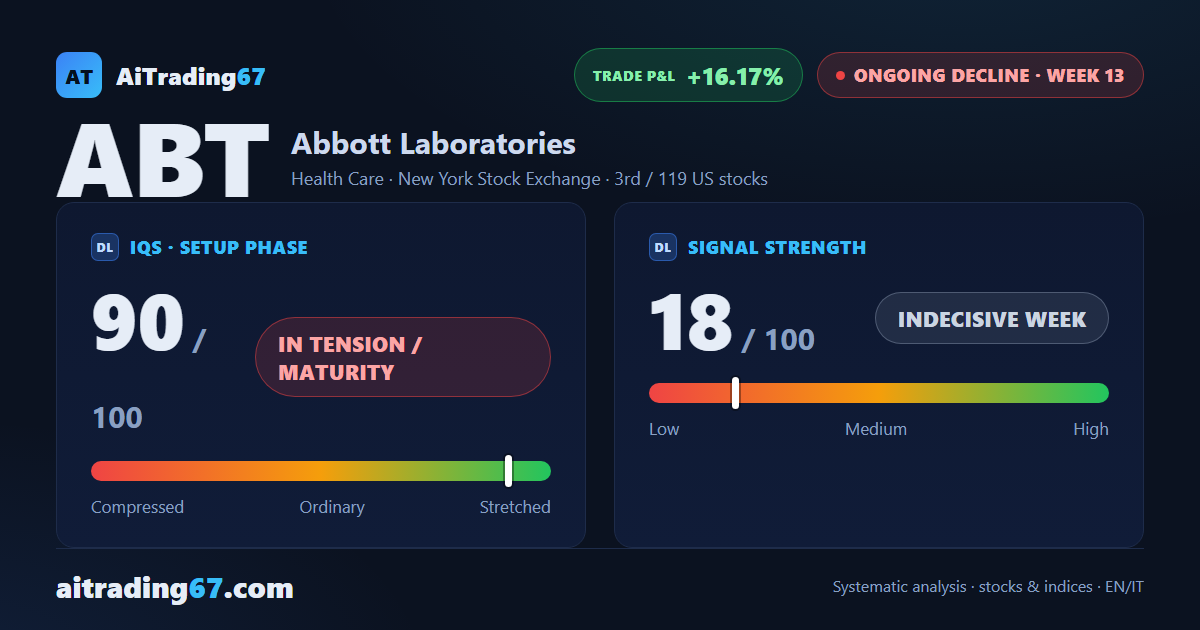
Abbott Laboratories is at week 13 of a sell signal, with the trade +16% from inception. The latest week closed nearly flat (+0.3%), but seller dominance held at 82% and distribution remained firmly in place. The technical picture is mixed: momentum is recovering from late-May lows, but the most recent candlestick shows extreme seller dominance and a strong distribution phase — 4 out of 11 price action components flagging caution.
Ongoing decline ·13th week from start ·US stocks ·T2 ★ See Gold version →
IQS Phase
90
in tension / maturity
Signal Strength
18
indecisive week
Sizing
MINIMUM
Ranking
#3 / 119
US stocks
Trade P&L %
+16.17%
from signal to today
Chart · Weekly — EMA50 · MACD · VWAP
Weekly chart · EMA50 · MACD · VWAP · Source: TradingView
How to read this pageA visual guide to the post, card by card
The full analysis, operating plan and detailed levels on this asset are reserved for clients ★ PLATINUM
restricted Platinum content
Share WhatsApp Telegram Gmail LinkedIn