
Abbott -1.5% heading into earnings week
Abbott slips 1.5% ahead of earnings, as daily and weekly charts diverge
Abbott -1.5% heading into earnings week
Our view last week
Abbott Laboratories opens a new buy signal, in its 1st week of trade. Signal strength is 59 out of 100, medium conviction and ordinary volatility: a steady case, not an explosive one. It ranks 50th among the 125 open buy positions in US stocks. The confirmation week closed bullish, but earnings are due July 16, about two weeks away — a timing factor worth watching.
This week's summary
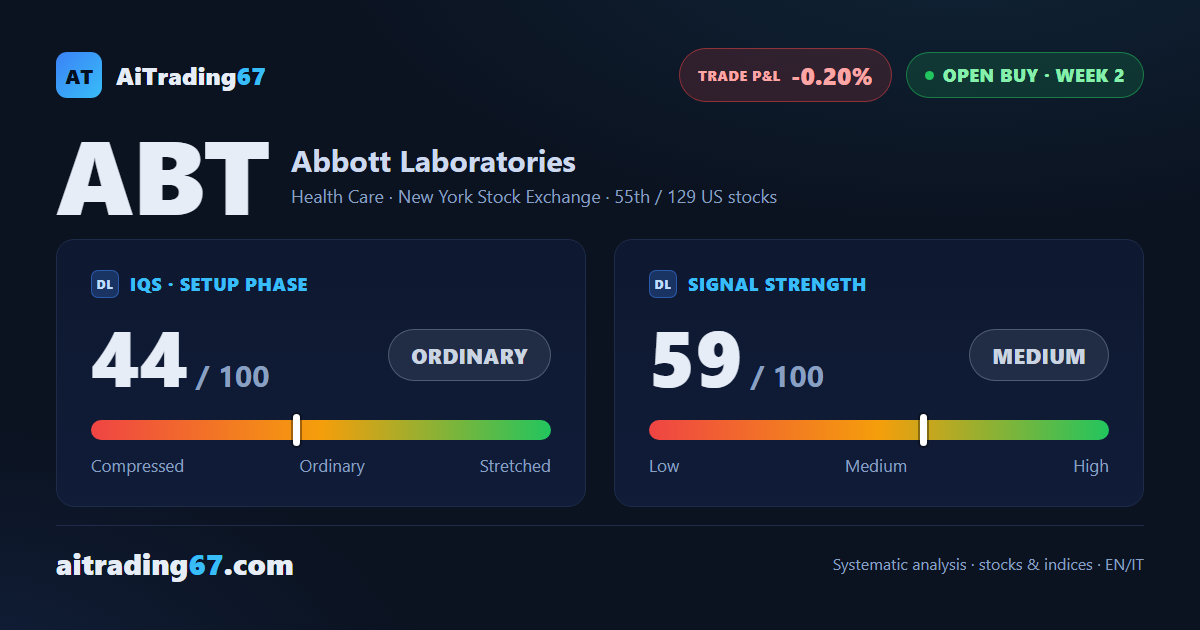
Abbott shares slip 1.5% in a week that tells two different stories: on the daily chart price keeps carving higher lows, from the 87 area to the 91 area, while on the weekly chart buyers are losing ground and sellers were sharply dominant in the last bar. Earnings, flagged last week as two weeks out, land this week — July 16 is right around the corner, and volatility could pick up. A steady, ordinary case in Health Care, with signal strength sitting in the middle of the range.
IQS Phase
44
ordinary
Signal Strength
59
medium
Sizing
STANDARD
Ranking
#55 / 129
US stocks in progress
Trade P&L %
-0.20%
from signal to today
restricted Platinum content