
Sell signal toughens up again this week
Archer Aviation drops 5% and retests its double bottom near the 4.6 area
Sell signal toughens up again this week
Our view last week
Archer Aviation is in the 4th week of a sell signal, and this week it bounced back 2.3%: the decline is not making fresh lows, and the signal strength falls to 34 out of 100 - a decline losing steam. The setup quality indicator, at 69 out of 100, remains in tension, and the stock ranks 67th among the 137 US sell signals. Trading conditions are still not recommended.
This week's summary
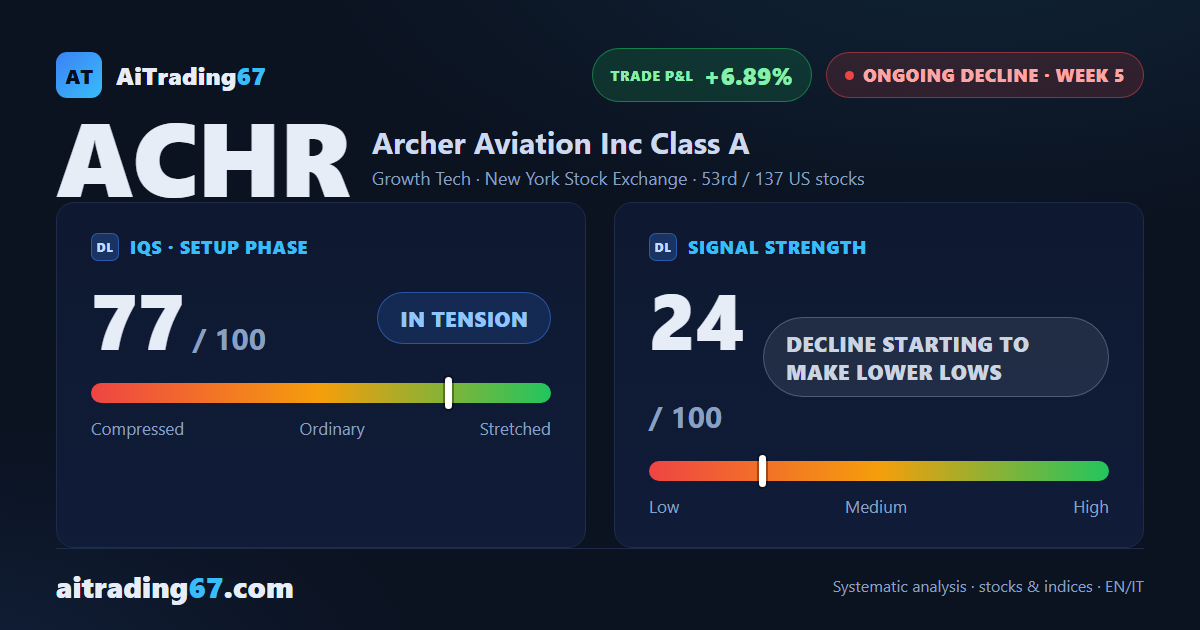
Archer Aviation is giving ground again: after last week's bounce, this week's price action shows a 5% drop with 95% of trading on the sell side, and money flow back in negative territory. The stock is boxed between the double bottom in the 4.6 area and the first resistance in the 4.78 area: the decline has resumed direction, though it hasn't yet broken below its recent lows.
IQS Phase
77
in tension
Signal Strength
24
decline starting to make lower lows
Sizing
MINIMUM
Ranking
#53 / 137
US stocks
Trade P&L %
+6.89%
from signal to today
restricted Platinum content