
Accenture, week 23 of a managed sell signal
Accenture slips 1.5% as the bounce stalls at its 7-day high
Accenture, week 23 of a managed sell signal
Our view last week
Week 22 of a sell signal on Accenture, and the week just closed tells a different story from the ones before it: +6.5%, with 91% of volume on the buy side. On the daily chart a double bottom has formed in the 120 area, with an intermediate rebound of 12%. The picture stays technically negative, and the signs of slowing are worth watching in the coming weeks.
This week's summary
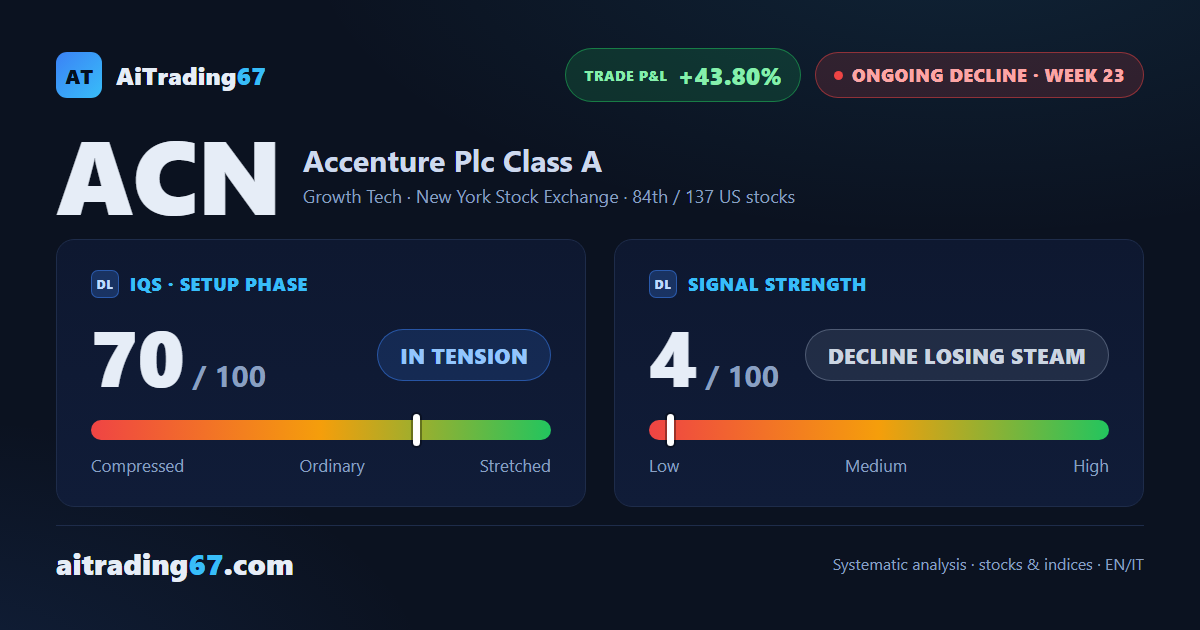
After last week's 6.5% rebound, Accenture shares gave back 1.5% this week, with the recovery attempt rejected right at its 7-day high. Our weekly technical analysis follows the sell signal into its 23rd week of management, with the short now more than 43% in profit: beneath the surface the decline keeps losing steam, momentum has improved for a third straight week and money flow stays positive, but the weekly structure is still broken and the technical picture remains negative.
IQS Phase
70
in tension
Signal Strength
4
decline losing steam
Sizing
MINIMUM
Ranking
#84 / 137
US stocks
Trade P&L %
+43.80%
from signal to today
restricted Platinum content