Fresh sell signal · week 1
Adobe under pressure: a wall of resistance holds it down
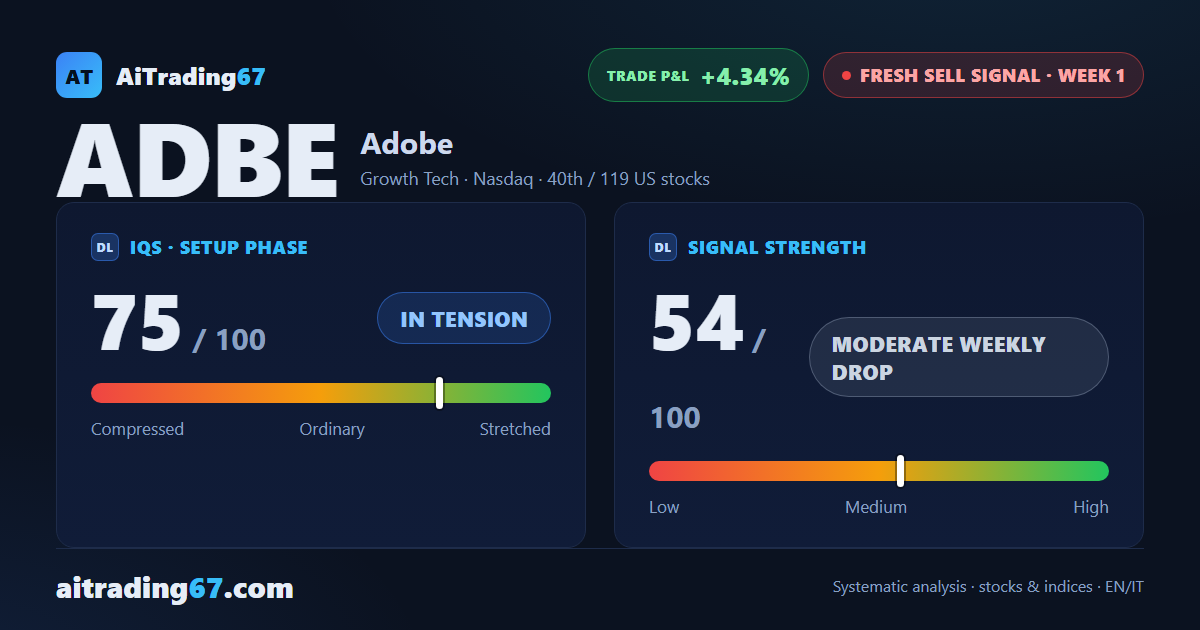
Fresh sell signal · week 1
In Summary
Adobe receives a fresh weekly sell signal in its 1st week, with an early gain already on the trade at +4% from inception. Technical structure is intermediate bearish, indicators are in distribution, and RSI has reached oversold territory — but the quality band flags trading not recommended: the setup is high risk. Adobe ranks 40th among the 119 US sell signals.
IQS Phase
75
in tension
Signal Strength
54
moderate weekly drop
Sizing
STANDARD
Ranking
#40 / 119
New us stocks
Trade P&L %
+4.34%
from signal to today
restricted Platinum content