
Adobe, week 5 of management: a rebound with cracks
Adobe adds 1.8%, but the Sell signal's rebound already shows cracks
Adobe, week 5 of management: a rebound with cracks
Our view last week
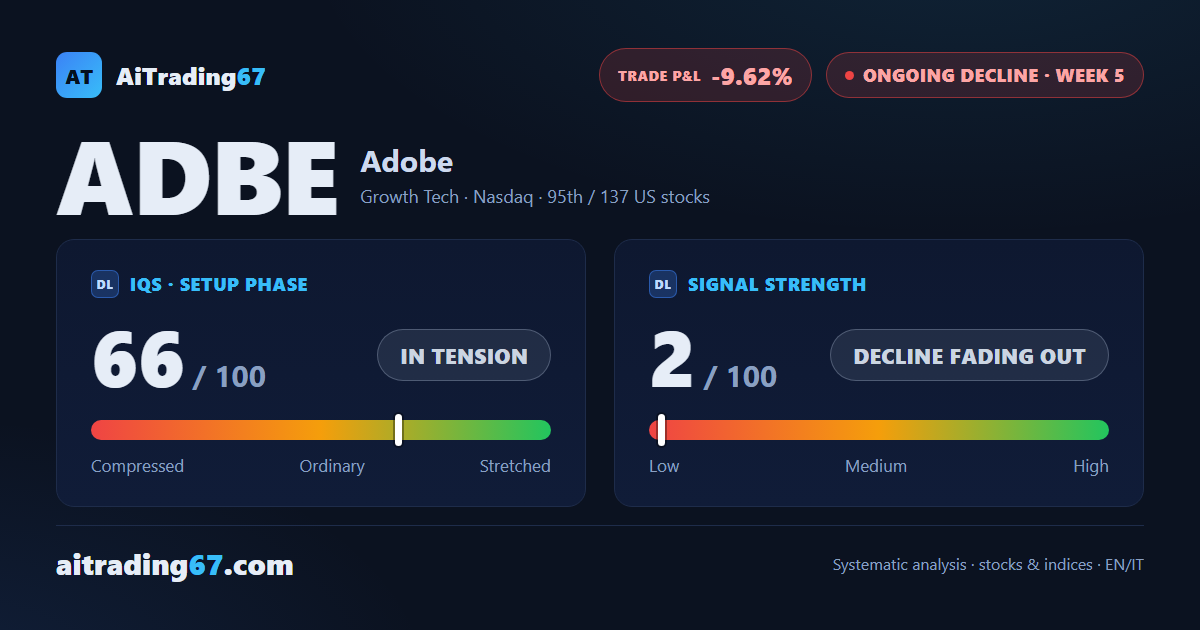
Adobe is in week 4 of a sell signal, and the week just closed up 8.4%. Signal strength has slipped to 2 out of 100: a decline that has burned through nearly all its momentum. The stock ranks 65th among the 137 US sell signals, and remains high-risk under our model.
This week's summary
Adobe's weekly MACD has crossed back above its own signal line after three weeks in a bearish cross — a sign of strength with some cracks, though: buyers are less convinced and the stock has slipped into distribution. Adobe shares stay boxed between support (217 area) and resistance (225 area); the Sell signal is in its fifth week of management, with the short showing a 9.6% loss.
IQS Phase
66
in tension
Signal Strength
2
decline fading out
Sizing
MINIMUM
Ranking
#95 / 137
US stocks
Trade P&L %
-9.62%
from signal to today
restricted Platinum content