
Adidas · Sell signal, week 10
Adidas slips 1.7% to a fresh 90-day low that the weekly close fails to confirm
Our view last week
After 6 straight down weeks, Adidas stock bounced 3%: the week touched its 30-day low, in the 139 area, then turned higher with buyers taking 74% of volume, up from 37% a week earlier. Weekly technical analysis still calls for caution: the rebound stalled at the 20-day moving average, in the 146.6 area, the MACD stays below its Signal line and money flow is still negative. For the short, now up 8.1%, price action needs close watching.
This week's summary
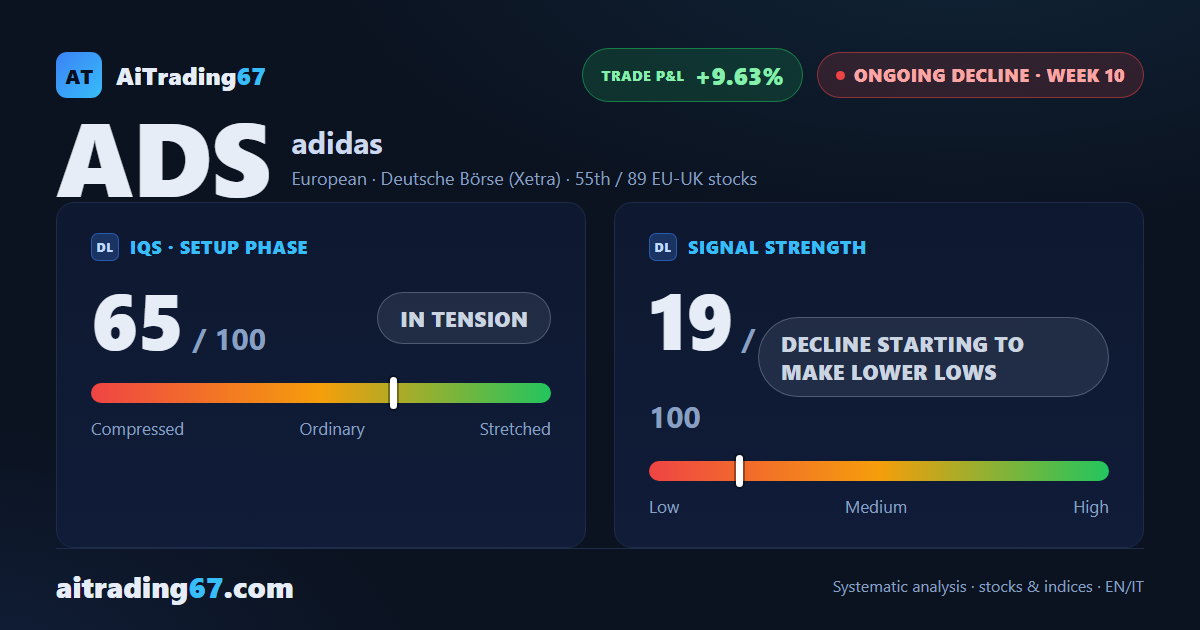
A fresh 90-day low for Adidas, in the 138 area, that the weekly close fails to confirm: the stock slips 1.7% and finishes in the upper half of its range. Last week's bounce had stalled at the 20-day moving average, and that line, in the 146 area, capped Adidas stock again. Weekly technical analysis stays bearish: MACD below its Signal line, money flow negative, volumes contracting. For the short, up 9.6%, price action shows a decline that holds its course but struggles to push lower.
IQS Phase
65
in tension
Signal Strength
19
decline starting to make lower lows
Sizing
MINIMUM
Ranking
#55 / 89
EU-UK stocks
Trade P&L %
+9.63%
from signal to date, no stop loss
adidas (ADS) weekly chart — EMA50 · MACD · VWAP
Weekly chart · EMA50 · MACD · VWAP · Source: TradingView
Rank position
ranks 55th among the 89 sell signals for European-UK stocks in our ranking, with a signal strength of 19 out of 100.
Sector context
SectorEuropean
Benchmark ETFEXH7
Sector regime
Performanceweekly coming soon · monthly coming soon
ADS belongs to the european sector (reference ETF EXH7).
restricted Platinum content