
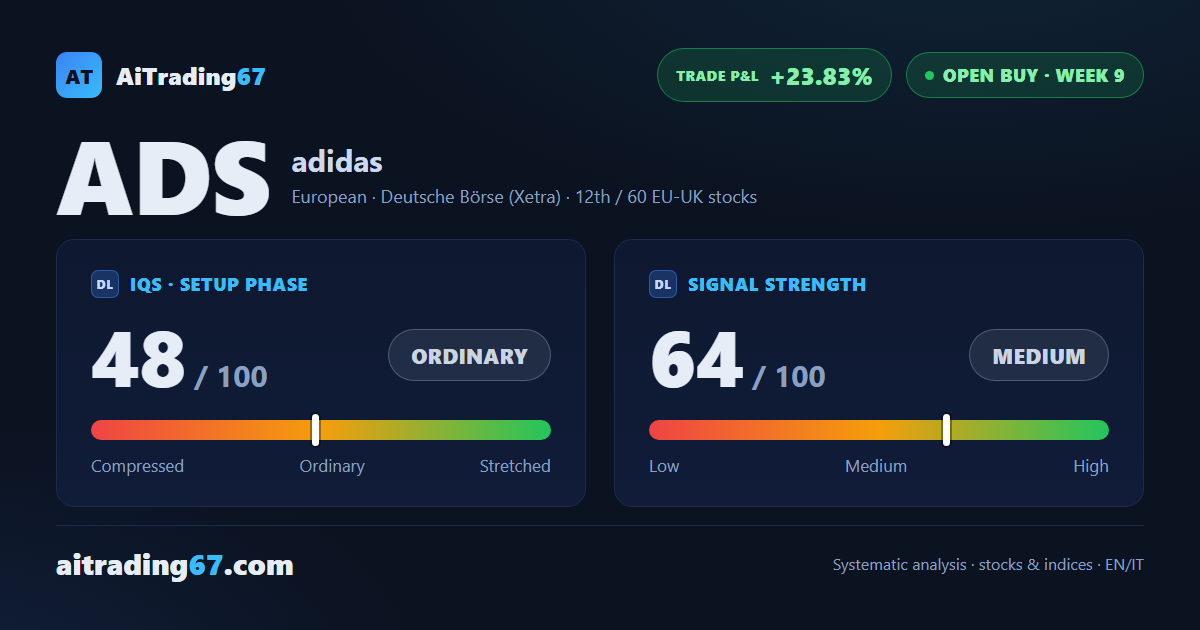
Buy signal, week 9, up 23.83%
Adidas dips 1.9% and tests its highs again as the trend gains breadth
Buy signal, week 9, up 23.83%
Our view last week
Adidas is in week 8 of an open buy setup, with the trade already up 26.18% since entry. Signal strength is medium, at 64 out of 100, and the setup quality indicator reads 53 out of 100: an ordinary, non-stretched picture. The stock ranks 14th among the 62 open buys in the European-UK stocks category. Management has already passed its second trimming window.
This week's summary
In this week's technical analysis, Adidas stock tests its recent highs again for the second time in ten weeks, with breakout-or-rejection tension still building. The week gave back 1.9%, but the trend is gaining breadth — the weekly ADX is climbing — while the MACD loses some shine. The trade, now in its ninth week and up 23.83%, climbs to 12th place among the 60 open European buys.
IQS Phase
48
ordinary
Signal Strength
64
medium
Sizing
STANDARD
Ranking
#12 / 60
EU-UK stocks in progress
Trade P&L %
+23.83%
from signal to today
restricted Platinum content