
Autodesk bounces, but buyers start to slow
Autodesk bounces 4.7% as buyer dominance starts to fade
Autodesk bounces, but buyers start to slow
Our view last week
Autodesk's rebound is losing steam: after last week's 5.7% surge, the stock climbed just 0.5% this week, with buyers slipping to 58% of volume from 86% last week. The Sell signal has been under management for 14 weeks, with the short still up 4.6%. Our weekly technical analysis tracks the trade step by step, while the underlying structure stays weak.
This week's summary
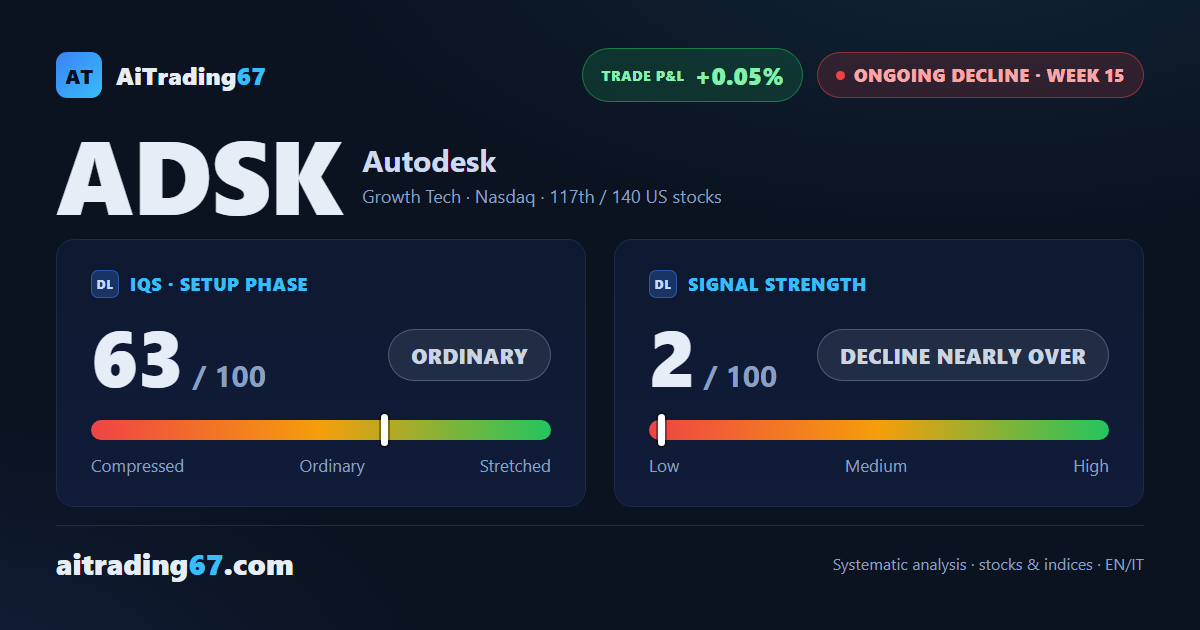
After last week's stall, Autodesk's bounce found its legs again: up 4.7% this week, with 83% of volume on the buy side. The stock is now on its fourth straight higher low in the daily chart, running from the 186 area to the 202 area. But underneath, buyers are starting to lose conviction bar by bar: the sell signal, under management for 15 weeks, is still very much alive, with the short up 5%.
IQS Phase
63
ordinary
Signal Strength
2
decline nearly over
Sizing
MINIMUM
Ranking
#117 / 140
US stocks
Trade P&L %
+0.05%
from signal to today
restricted Platinum content