
Sell signal in week 4, the decline stalls
Airbnb bounces 3.1% after 4 down weeks and stalls under its averages in the 164 area
Our view last week
On the daily chart Airbnb stock lines up 4 lower highs, from the 187 area down to the 170 area, and the week closes 5.3% lower, with sellers ahead in the weekly bar. A week ago the decline wasn't making new lows; now signal strength, on the rise, reads it as a decline starting to make lower lows. Price is pinned between the 100-day moving average, in the 157.5 area, and a support in the 155.8 area. On this technical analysis and price action, fresh shorts are still not recommended.
This week's summary
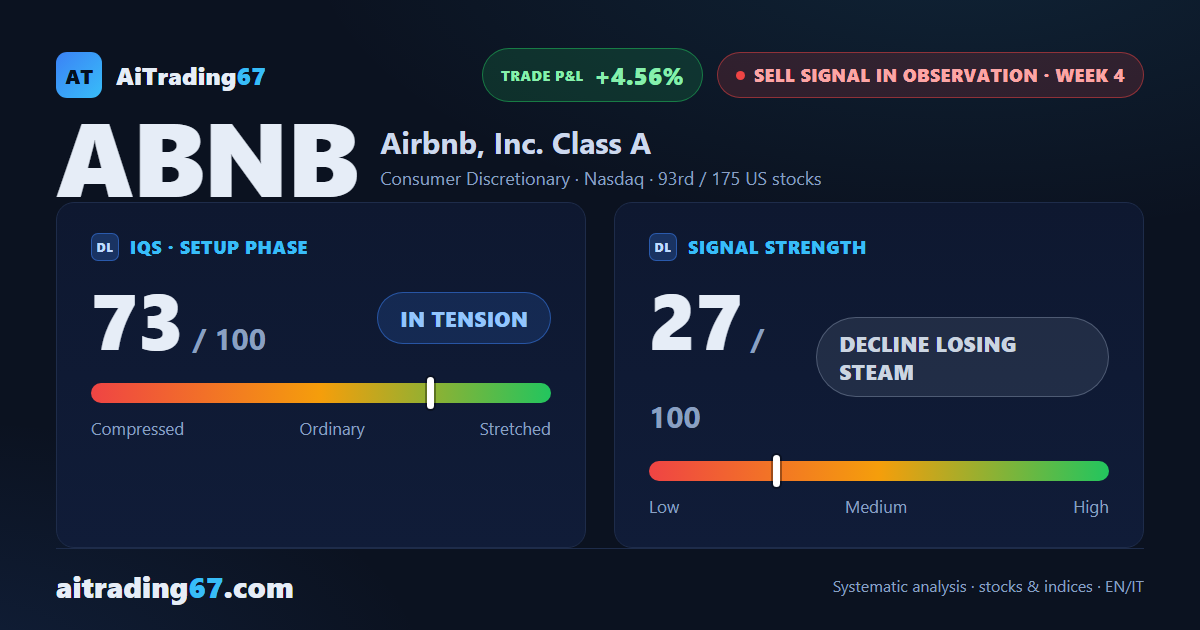
After 4 straight down weeks Airbnb bounces 3.1% and reclaims its 20-week moving average, in the 159 area. The rebound stalls under the cluster of daily averages in the 164 area, while the weekly MACD slips below its Signal line after 15 weeks above it. A week ago the decline was making lower lows; now signal strength, falling, reads it as a decline losing steam. On this technical analysis of Airbnb stock the Sell signal stays live, and for swing trading fresh shorts remain not recommended.
IQS Phase
73
in tension
Signal Strength
27
decline losing steam
Sizing
MINIMUM
Ranking
#93 / 175
US stocks sell signals
Trade P&L %
+4.56%
from signal to date, no stop loss
Airbnb (ABNB) weekly chart — EMA50 · MACD · VWAP
Weekly chart · EMA50 · MACD · VWAP · Source: TradingView
Rank position
ranks 93rd among the 175 sell signals for US stocks in our ranking, with a signal strength of 27 out of 100.
Sector context
SectorConsumer Discretionary
Benchmark ETFXLY
Sector regimeweak phase
Performanceweekly -0.47% · monthly -4.20%
ABNB belongs to the consumer discretionary sector (reference ETF XLY). The sector is classified weak phase according to our weekly reading.
restricted Platinum content