
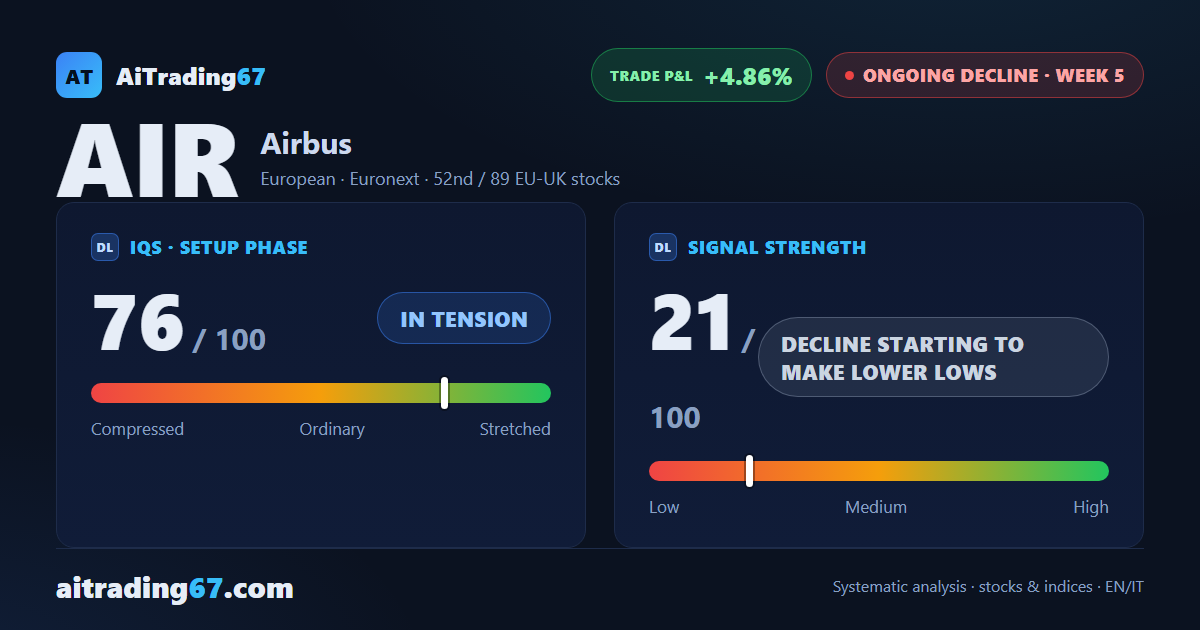
Ongoing decline · week 5 · Euronext
Airbus slips 1.6% onto its 50-week average after 6 lower highs on the daily chart
Our view last week
On the daily chart Airbus has printed a bearish engulfing, and the week closed down 0.5%: sellers have held the volume for a second week, yet the decline finds no fresh push. Seven days ago the weekly MACD had just slipped below its signal line; now signal strength has halved. Airbus stock stays boxed between its 20-week average, in the 195 area, and the lower daily Bollinger Band, in the 192 area: a picture to read through price action trading.
This week's summary
Airbus slips 1.6% and falls out of the band that boxed it in a week ago, coming to rest on its 50-week moving average, in the 189 area. During the week it printed a fresh 30-day low that the close did not confirm. Price action in Airbus stock stays weak: 6 lower highs on the daily chart and money flow still deteriorating. For swing trading, what matters now is whether that average holds, with earnings due on October 28.
IQS Phase
76
in tension
Signal Strength
21
decline starting to make lower lows
Sizing
MINIMUM
Ranking
#52 / 89
EU-UK stocks
Trade P&L %
+4.86%
from signal to date, no stop loss
Airbus (AIR) weekly chart — EMA50 · MACD · VWAP
Weekly chart · EMA50 · MACD · VWAP · Source: TradingView
Rank position
ranks 52nd among the 89 sell signals for European-UK stocks in our ranking, with a signal strength of 21 out of 100.
Sector context
SectorEuropean
Benchmark ETFEXH4
Sector regimeweak phase
Performanceweekly -0.03% · monthly +0.15%
AIR belongs to the european sector (reference ETF EXH4). The sector is classified weak phase according to our weekly reading.
restricted Platinum content