
The rally slows, the flows hold up
Allianz adds 0.4% and stalls near its highs, but the flows hold up
The rally slows, the flows hold up
Our view last week
Allianz is at week 12 of a buy signal, and the picture stays solid: bullish weekly structure, setup quality indicator at 74 out of 100 in a tension-of-maturity phase, signal strength at 56 out of 100. The trade has completed our most advanced model's coverage and runs at +11.26% since entry, with the stop now trailing the Inversion Point.
This week's summary
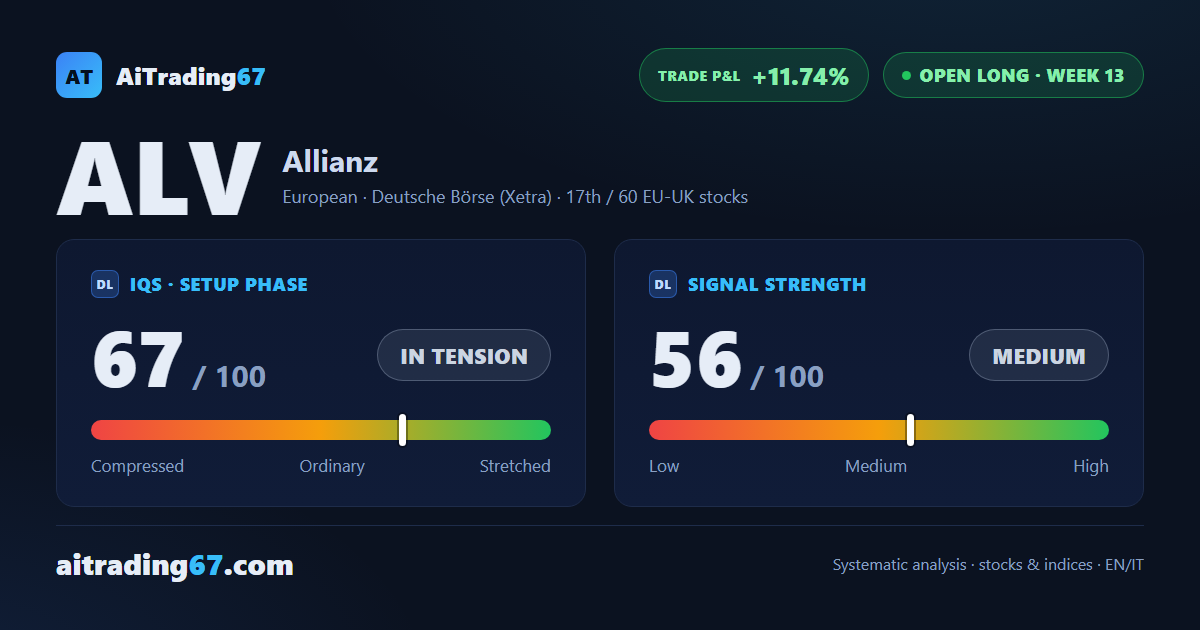
Allianz stalls right near its highs: the stock added just 0.4% this week, with volume contracting and buyer dominance clearly fading. The weekly technical analysis tells a different story, though — MACD, momentum and money flow keep improving. The trade, in its 13th week, now runs at +11.74% since entry.
IQS Phase
67
in tension
Signal Strength
56
medium
Sizing
STANDARD
Ranking
#17 / 60
EU-UK stocks in progress
Trade P&L %
+11.74%
from signal to today
restricted Platinum content