
Applied Materials: heavy selling cools the rally
Applied Materials drops 12.1% as its months-long rally loses steam
Applied Materials: heavy selling cools the rally
Our view last week
Applied Materials technical analysis: after a week of heavy selling (87% of volume), buyers took back control - 73% of trading on the buy side - while price stayed nearly flat, -0.1%. The weekly ADX climbs to 45, the trend gaining conviction, but the RSI has stayed overbought for weeks and the stock is now working a tight corridor between support and resistance. The trade is running above +216% since entry.
This week's summary
Applied Materials reverses course from a week ago: after buyers had taken back control (73% of trading), this week the pendulum swings back with a 12.1% drop and 84% of volume on the sell side. The weekly RSI slips to 63 from 85 three weeks ago, and the MACD has been losing steam for four straight weeks. Price stays boxed between the 514 and 531 areas, with the underlying structure still bullish.
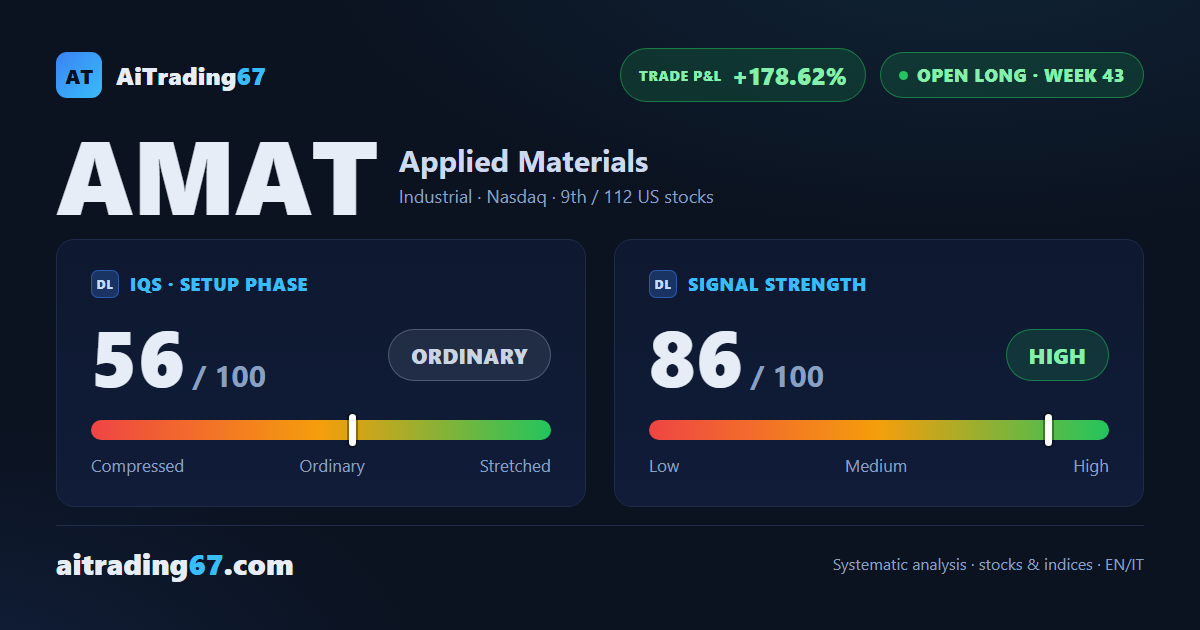
IQS Phase
56
ordinary
Signal Strength
86
high · wide & volatile
Sizing
FULL
Ranking
#9 / 112
US stocks in progress
Trade P&L %
+178.62%
from signal to today
restricted Platinum content