
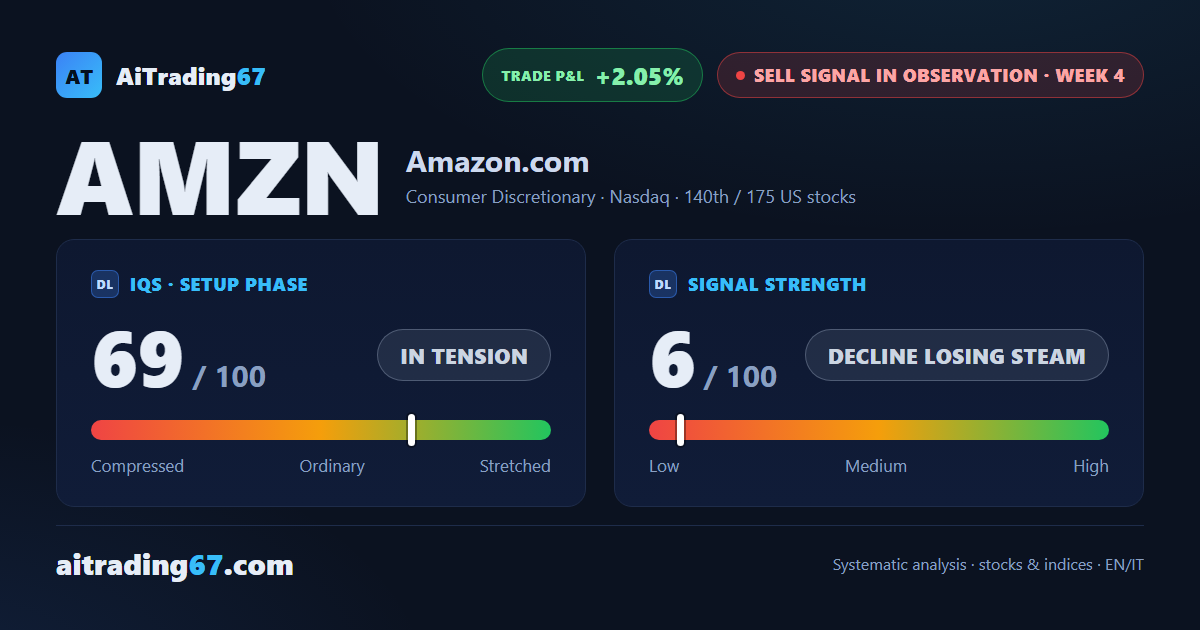
Sell signal in observation · week 4
Amazon edges up 0.7% after 4 straight losses as the Sell signal runs out of push
Our view last week
A 4th straight weekly loss for Amazon: the stock slips 1.6% after a firm rejection from the cluster of moving averages between the 251 and 256 areas. Sellers lead the weekly bar, yet money flow moves back above zero after 13 negative weeks, leaving the price action undecided. In our technical analysis of Amazon stock the sell signal gains strength, but among US stocks it remains a high-risk trade setup for anyone looking to open a short.
This week's summary
Amazon snaps a run of 4 weekly losses with a 0.7% gain, yet the recovery stalls once more under the band of daily moving averages between the 251 and 253 areas. A week ago the sell signal seemed to be gaining strength; now it has lost nearly all its push: Signal Strength drops to 6 out of 100 and the ADX, below 10, has been falling for 8 weeks. In our technical analysis of Amazon stock the price action stays undecided, and among US stocks this trade setup remains high-risk for a new short.
Sell signal in observation
·4th week from start
·US stocks
·T2
·📅 Earnings · Oct 29
★ See Gold version →
IQS Phase
69
in tension
Signal Strength
6
decline losing steam
Sizing
MINIMUM
Ranking
#140 / 175
US stocks sell signals
Trade P&L %
+2.05%
from signal to date, no stop loss
Amazon (AMZN) weekly chart — EMA50 · MACD · VWAP
Weekly chart · EMA50 · MACD · VWAP · Source: TradingView
Rank position
ranks 140th among the 175 sell signals for US stocks in our ranking, with a signal strength of 6 out of 100.
Sector context
SectorConsumer Discretionary
Benchmark ETFXLY
Sector regimeweak phase
Performanceweekly -0.47% · monthly -4.20%
AMZN belongs to the consumer discretionary sector (reference ETF XLY). The sector is classified weak phase according to our weekly reading.
restricted Platinum content