
A rebound tests the decline
Ambev rebounds 3.4% as money flow turns positive after 28 weeks
Our view last week
Below the moving-average cluster in the 15.5 area, Ambev stock closed the week down 0.4%, with sellers at 73% of volume: a week ago they held 86%, and trading is now thinning out. Money flow keeps digging deeper into negative ground, while the weekly MACD histogram lifts its head slightly. For swing trading readers, the technical analysis shows a Sell signal moving in short steps, boxed between the 20-day moving average in the 15.5 area and support in the 15.3 area.
This week's summary
After 3 weeks of declines, Ambev stock bounces 3.4% off its 20-day moving average and money flow climbs back above zero for the first time in 28 weeks. In the weekly technical analysis the Sell signal stays live, with the MACD still below its Signal line. The close and the Inversion Point, in the 15.7 area, have already crossed with no change of sign declared: one to watch in the coming sessions.
Ongoing decline
·8th week from start
·Rest of the World stocks
·T2
·📅 Earnings · Oct 29
★ See Gold version →
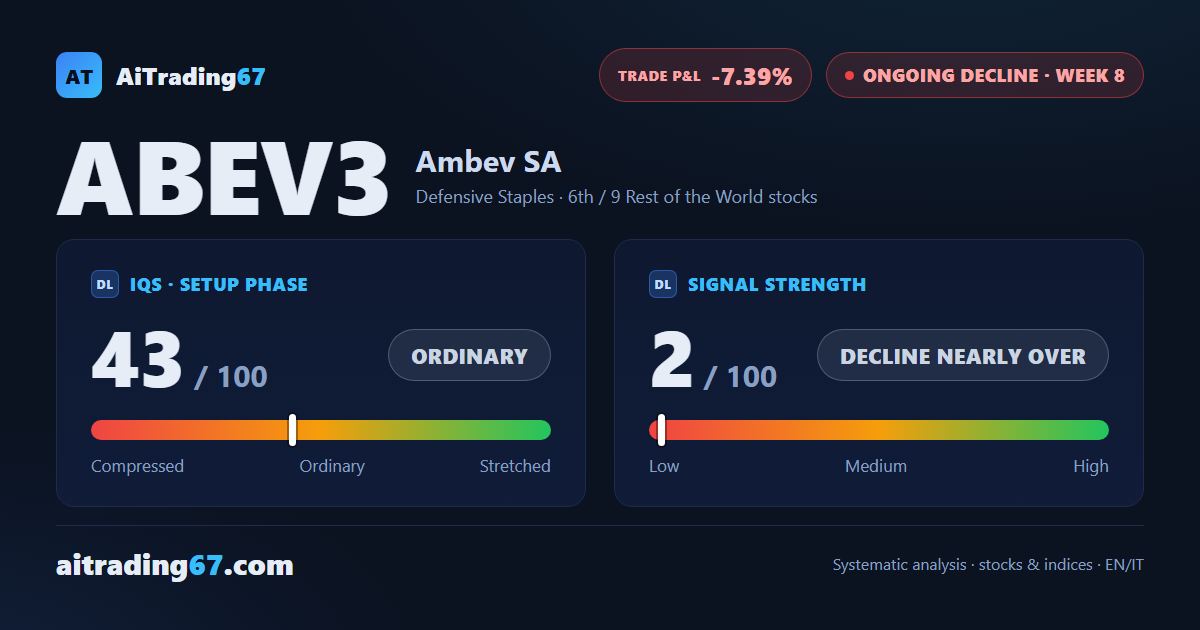
IQS Phase
43
ordinary
Signal Strength
2
decline nearly over
Sizing
MINIMUM
Ranking
#6 / 9
Rest of the World stocks
Trade P&L %
-7.39%
from signal to date, no stop loss
Ambev (ABEV3) weekly chart — EMA50 · MACD · VWAP
Weekly chart · EMA50 · MACD · VWAP · Source: TradingView
Rank position
ranks 6th among the 9 sell signals for titoli resto del mondo in our ranking, with a signal strength of 2 out of 100.
Sector context
SectorDefensive Staples
Benchmark ETFXLP
Sector regimeweak phase
Performanceweekly -1.86% · monthly -5.85%
ABEV3 belongs to the defensive staples sector (reference ETF XLP). The sector is classified weak phase according to our weekly reading.
restricted Platinum content