
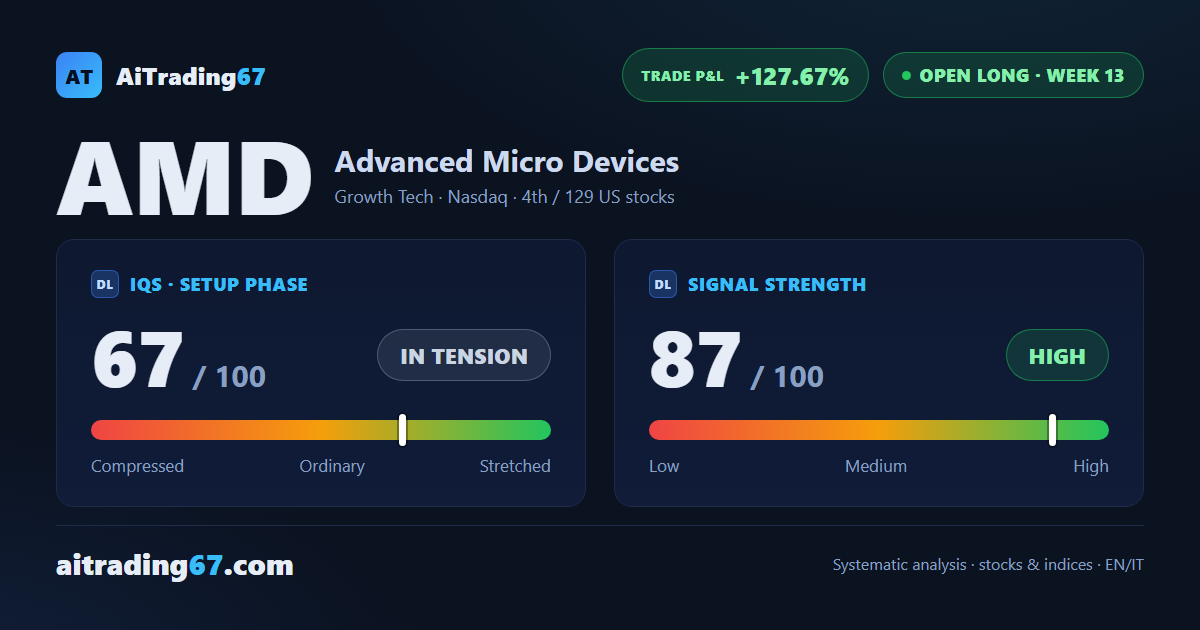
AMD, week 13 in management: trade at +127.7%
AMD +7.7% and back near the highs, but momentum is losing steam
AMD, week 13 in management: trade at +127.7%
Our view last week
Advanced Micro Devices is in week 12 of a long trade whose model coverage is now complete: all 3 statistical targets have been hit, and the trade continues with the residual capital, currently at +111.32% since entry. The stop trails the Inversion Point, in the 457 area. On the technical side the week closed slightly lower, with weekly momentum cooling after the mid-June peak.
This week's summary
Advanced Micro Devices jumps 7.7% this week and climbs back near its recent highs, driven by dominant buyers (80% of volume). But beneath the surface the picture is cooling: money flow and weekly momentum have been sliding for a month, and the RSI still sits in persistent overbought territory. The trade now stands at +127.7% since entry.
IQS Phase
67
in tension
Signal Strength
87
high · wide & volatile
Sizing
FULL
Ranking
#4 / 129
US stocks in progress
Trade P&L %
+127.67%
from signal to today
restricted Platinum content