
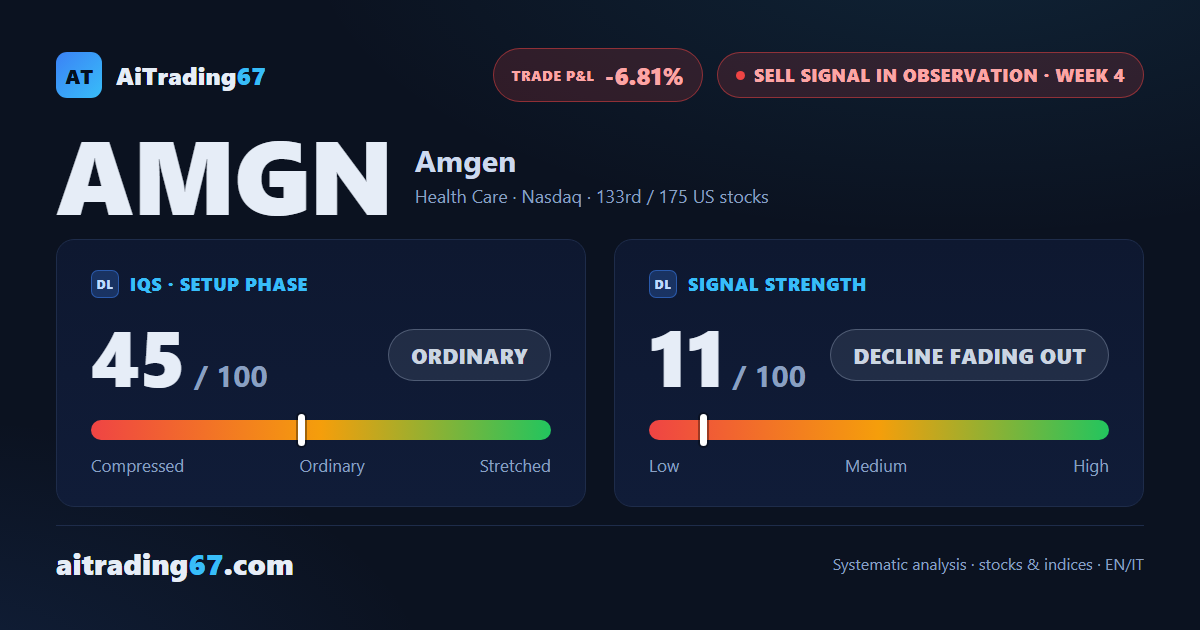
Sell signal, week 4 · US stocks
Amgen slips 2.8% and falls back under the daily Kumo ceiling it cleared a week ago
Our view last week
Last week the bounce stalled under the daily Kumo ceiling; this time Amgen stock pushes 7.5% higher and clears it. Daily price action shows a rebound off the 20-day average, with 94.6% of the last session's volume on the buy side. Price closed above the first stop level (SL1) and the second stop level (SL2) flagged in last week's card (408.3 area, 412.8 area): for anyone following those levels the trade is closed. The close and the Inversion Point, in the 414 area, have already crossed with no change of sign declared: one to watch in the coming sessions.
This week's summary
The break above the daily Kumo ceiling lasted one week: Amgen slips 2.8% and falls back inside the cloud, after a new short-term high that the weekly close did not confirm. A week ago the close and the Inversion Point had crossed; no change of sign followed, and Amgen stock is back below that line. Our weekly technical analysis reads a Sell signal that is fading out, with price still above the 50-week average: for now, one of the healthcare stocks to watch.
IQS Phase
45
ordinary
Signal Strength
11
decline fading out
Sizing
MINIMUM
Ranking
#133 / 175
US stocks sell signals
Trade P&L %
-6.81%
from signal to date, no stop loss
Amgen (AMGN) weekly chart — EMA50 · MACD · VWAP
Weekly chart · EMA50 · MACD · VWAP · Source: TradingView
Rank position
ranks 133rd among the 175 sell signals for US stocks in our ranking, with a signal strength of 11 out of 100.
Sector context
SectorHealth Care
Benchmark ETFXLV
Sector regimein positive regime
Performanceweekly -2.65% · monthly -3.91%
AMGN belongs to the health care sector (reference ETF XLV). The sector is classified in positive regime according to our weekly reading.
restricted Platinum content