
Amgen's bounce holds on the double bottom
Amgen adds 0.8% and confirms its double bottom in the 336 area
Amgen's bounce holds on the double bottom
Our view last week
Amgen's buy signal is in its fourth week, and the week just closed changed the rhythm: the stock gave back 2.9%, with buyer dominance sliding hard and sellers ruling the last candle. The weekly structure holds up though — moving averages aligned, price above the Ichimoku cloud — and the MACD keeps improving. The trade's gain has narrowed to 2.3% since entry, and signal strength stays modest, at 33 out of 100: caution leads the trade.
This week's summary
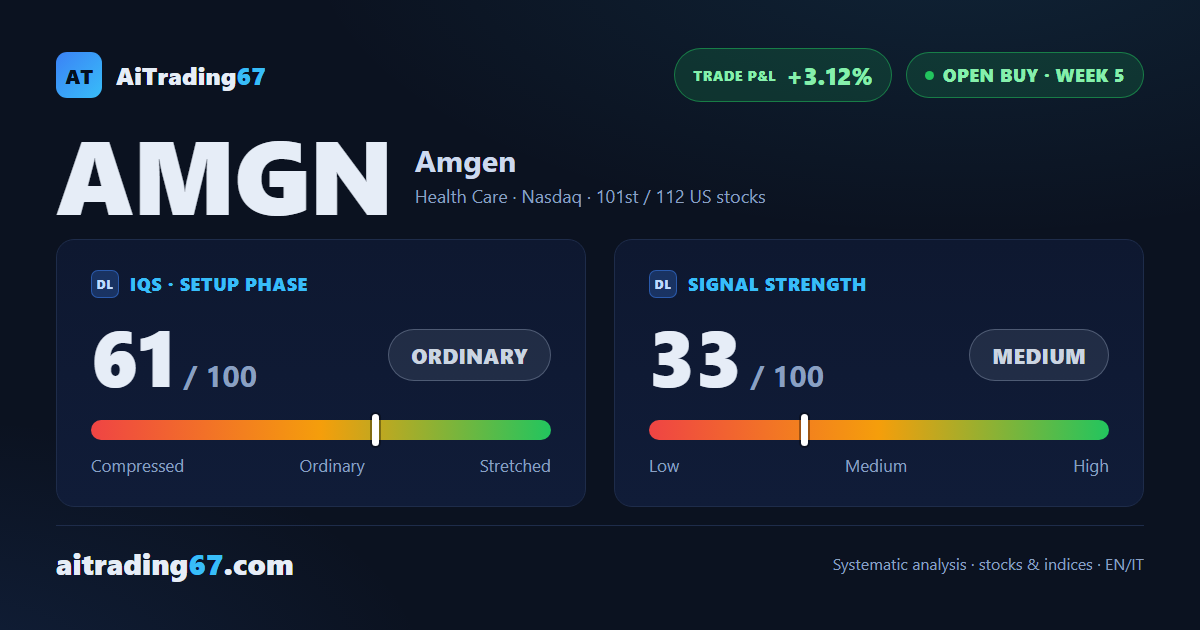
Amgen's stock steadies after last week's slide: this week it adds 0.8% and confirms the double bottom in the 336 area, with a 7% intermediate rebound behind it. The weekly structure stays solid — moving averages aligned, price above the Ichimoku cloud — but buyer dominance keeps fading. Five weeks into the buy signal, the gain sits at 3.12% since entry, and in technical analysis terms the stock is working just under its first resistance.
IQS Phase
61
ordinary
Signal Strength
33
medium · weak
Sizing
REDUCED
Ranking
#101 / 112
US stocks in progress
Trade P&L %
+3.12%
from signal to today
restricted Platinum content