EN IT

Amazon under pressure: bearish structure, but the market is testing support

Amazon.com weekly technical analysis — week 2 of a sell signal, bearish structure, IQS at 45/100. Trading not recommended per our model: the stock remains 28% above the 200-week moving average. Trade setup for positioned traders only.

Amazon under pressure: bearish structure, but the market is testing support
Sell signal · week 2
Amazon under pressure: bearish structure, but the market is testing support
June 19, 2026
Sell signal · week 2
In Summary
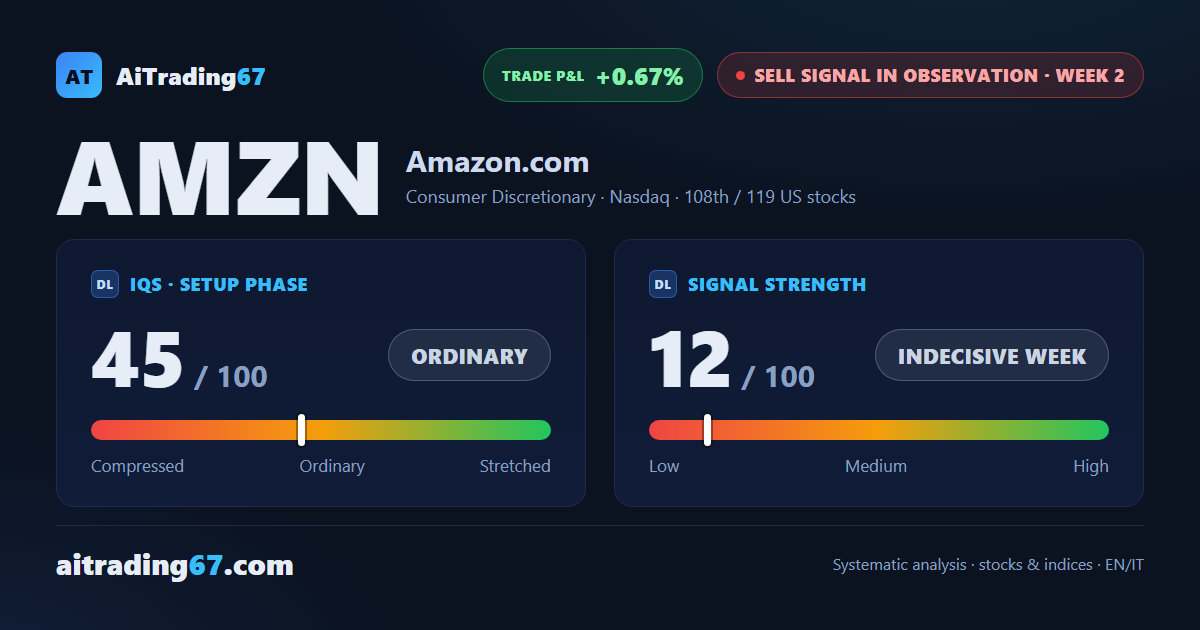
Amazon is in week 2 of a sell signal, ranking 108th among the 119 sell signals for US stocks. The week just closed was one of indecision — minimal decline — but the weekly structure remains bearish and distribution indicators have not eased. Trading is not recommended per our model: the stock trades 28% above the 200-week moving average, in a structurally elevated zone.
Sell signal in observation ·2nd week from start ·US stocks ·T2 ★ See Gold version →
IQS Phase
45
ordinary
Signal Strength
12
indecisive week
Sizing
MINIMUM
Ranking
#108 / 119
US stocks sell signals
Trade P&L %
+0.67%
from signal to today
Chart · Weekly — EMA50 · MACD · VWAP
Weekly chart · EMA50 · MACD · VWAP · Source: TradingView
How to read this pageA visual guide to the post, card by card
The full analysis, operating plan and detailed levels on this asset are reserved for clients ★ PLATINUM
restricted Platinum content
Share WhatsApp Telegram Gmail LinkedIn