
Sell signal stalls in its second week
Applied Digital drops 5.8% as its double-bottom bounce gets rejected
Sell signal stalls in its second week
Our view last week
New sell signal on Applied Digital, in its 1st week: the week just closed shed 15.6%, and the decline is making lower lows, pace holding. The signal strength is 80 out of 100, and the stock ranks 61st among the 137 US sell signals. The setup quality indicator at 70 out of 100 is in tension: our model judges the opening high-risk.
This week's summary
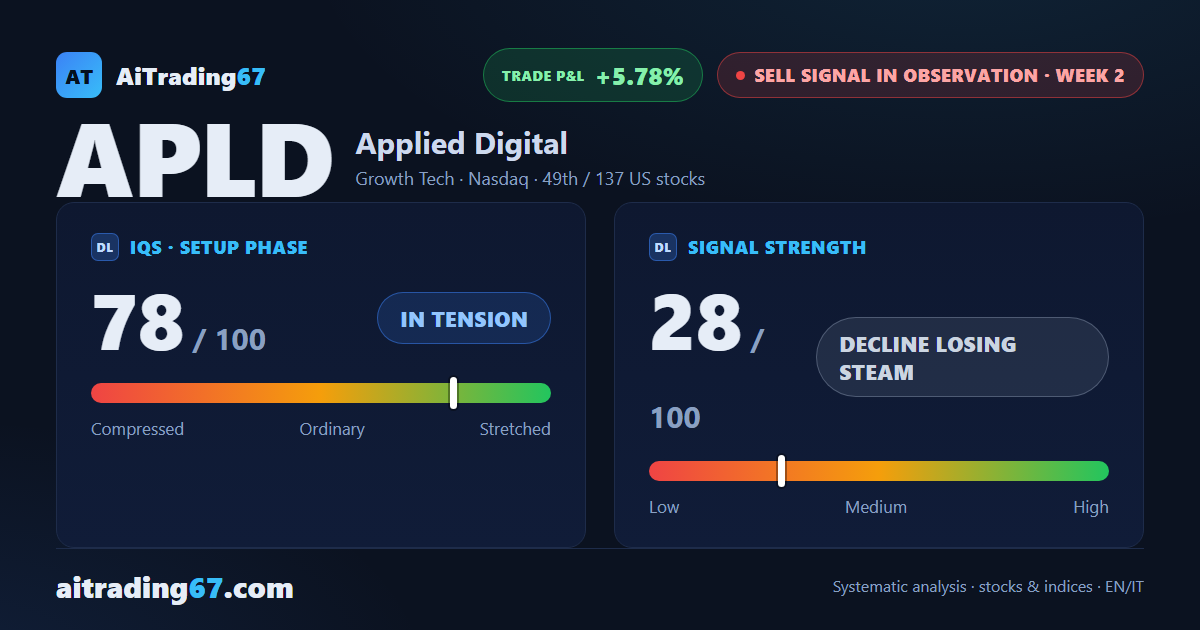
In this week's technical analysis, Applied Digital carved out a double bottom in the 31 area, with a 17% intraweek rebound that got rejected into the close: sellers dominated the final session and the stock closed down 5.8%. Compared with last week, when the decline was making lower lows with signal strength at 80, the picture shifts: strength collapses to 28, "decline losing steam." The setup quality indicator, though, climbs to 78 out of 100 — a sign the setup keeps getting tighter.
IQS Phase
78
in tension
Signal Strength
28
decline losing steam
Sizing
MINIMUM
Ranking
#49 / 137
US stocks sell signals
Trade P&L %
+5.78%
from signal to today
restricted Platinum content