
AppLovin · sell signal, week 3
AppLovin drops 3.8%: sellers surge back, but the decline still lacks punch
AppLovin · sell signal, week 3
Our view last week
AppLovin is in week 2 of a sell signal, and the week just closed jumped 10.5%: a move that pushes the price back toward the Pivot Point, in the 552 area, and drives signal strength down to 2 out of 100. The setup quality indicator, at 43 out of 100, stays in ordinary range, and AppLovin ranks 132nd among the 137 US sell signals: the quality band flags a new short here as high risk.
This week's summary
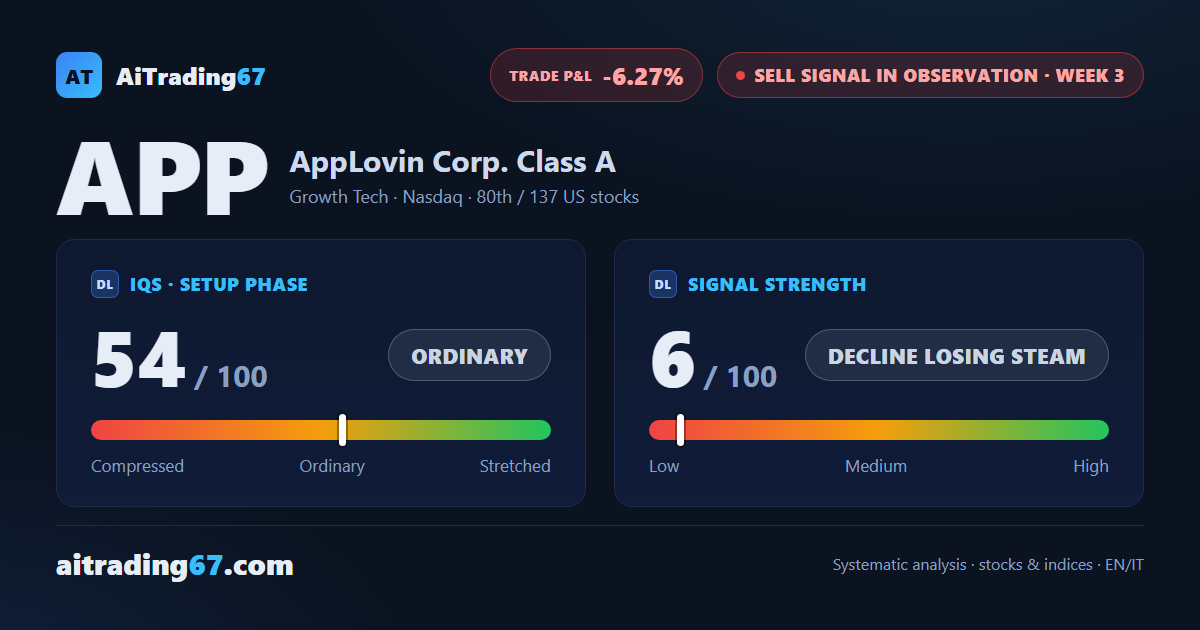
Sellers push back hard in the final session on AppLovin, after last week's bounce that nearly snuffed out the sell signal. The stock is down 3.8% for the week, but the bearish push stays weak: no fresh low, and Signal Strength ticks up to just 6 out of 100. With the stock still 72.3% above its 200-week average, our model flags a new short here as high risk.
IQS Phase
54
ordinary
Signal Strength
6
decline losing steam
Sizing
MINIMUM
Ranking
#80 / 137
US stocks sell signals
Trade P&L %
-6.27%
from signal to today
restricted Platinum content