
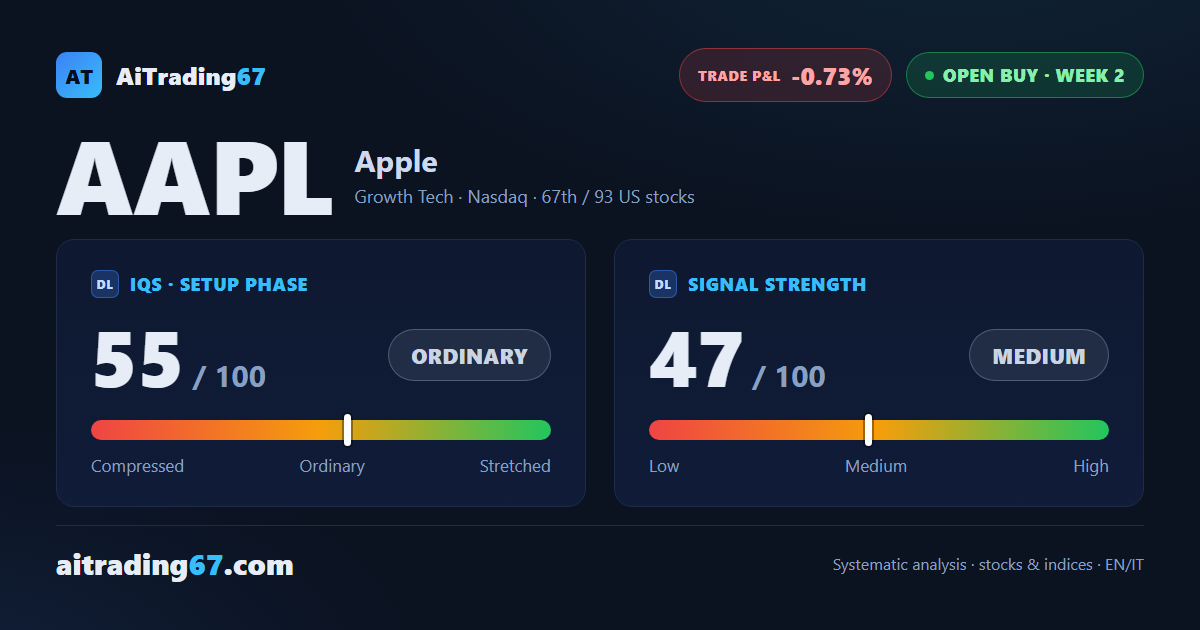
Open buy · week 2 of the signal
Apple slips 2.2% after 6 straight gains and bounces off its 20-day average
Our view last week
A 6th straight weekly gain for Apple, +1.5%, and last week's buy signal is holding: the week after the start closed higher and confirmed the entry. Apple stock trades just over 1% below its all-time high, with the ADX rising for 4 weeks and the MACD above its Signal line. Among tech stocks this technical analysis still calls for restraint: volume is contracting and mixed rejection candles are showing, price action that argues for waiting on a pullback.
This week's summary
After 6 straight weekly gains Apple stock pauses: down 2.2%, with the all-time high approached and left uncleared. A week ago the technical analysis called for restraint and for waiting on a pullback: it has come, and on the daily chart the price bounced 2% off its 20-day average. The buy signal stays open, among our weekly buy signals on tech stocks, with the weekly MACD above its Signal line but its histogram falling. Price action now has to prove it can hold.
IQS Phase
55
ordinary
Signal Strength
47
medium · weak
Sizing
REDUCED
Ranking
#67 / 93
US stocks in progress
Trade P&L %
-0.73%
from signal to date, no stop loss
Apple (AAPL) weekly chart — EMA50 · MACD · VWAP
Weekly chart · EMA50 · MACD · VWAP · Source: TradingView
Rank position
ranks 67th among the 93 Longs already running for US stocks in our ranking, with a signal strength of 47 out of 100.
Sector context
SectorGrowth Tech
Benchmark ETFXLK
Sector regimein strong phase
Performanceweekly +1.80% · monthly +8.83%
AAPL belongs to the growth tech sector (reference ETF XLK). The sector is classified in strong phase according to our weekly reading.
restricted Platinum content