
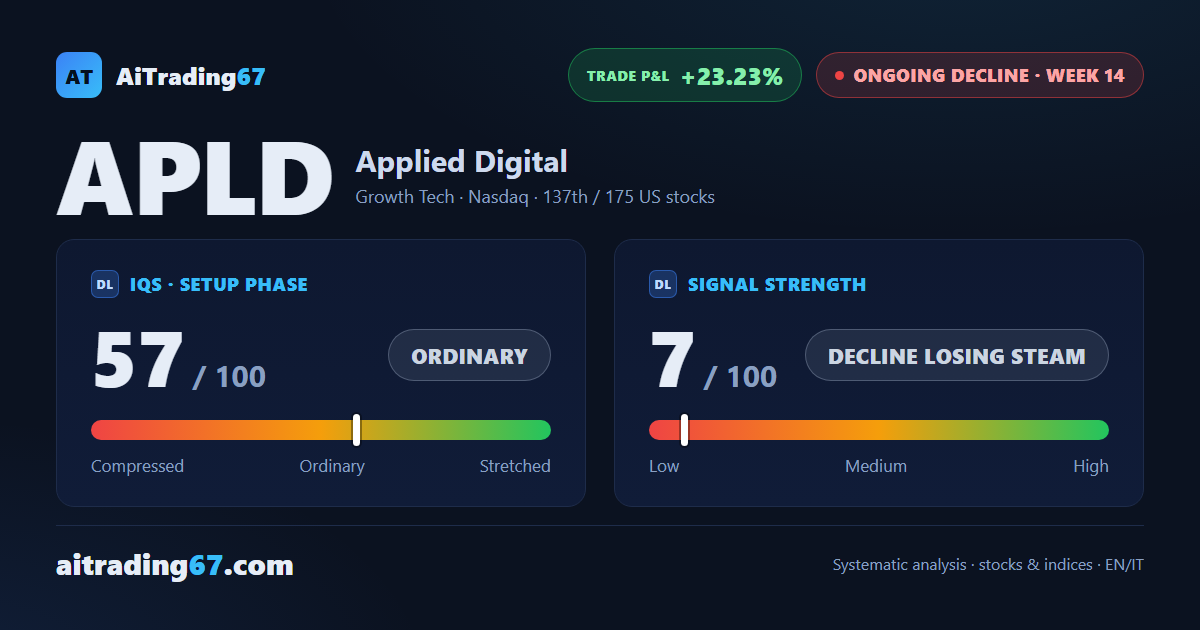
Ongoing decline · earnings on October 7
Applied Digital slips 3.3% and heads into earnings with 3 lower highs on the chart
Our view last week
Applied Digital's rebound has stalled: the week closed down 6.7% with 91% of volume on the sell side, after 3 up weeks, and a bearish engulfing bar has formed on the daily chart. Applied Digital stock stays inside a Sell signal, with the short back above 20% in profit. For this name among US tech stocks, the technical analysis now watches a tight band between the 26.2 and 26.3 areas, while weekly price action points to distribution.
This week's summary
A second straight down week for Applied Digital, off 3.3% after last week's 6.7% drop: the daily chart now shows 3 lower highs, and price printed a new 7-day low in the 23.6 area without confirming it on the weekly close. Applied Digital stock stays inside a Sell signal, with the short more than 23% in profit. For technical analysis, and for swing trading, the key test is the October 7 earnings report, on a name with elevated volatility.
IQS Phase
57
ordinary
Signal Strength
7
decline losing steam
Sizing
MINIMUM
Ranking
#137 / 175
US stocks
Trade P&L %
+23.23%
from signal to date, no stop loss
Applied Digital (APLD) weekly chart — EMA50 · MACD · VWAP
Weekly chart · EMA50 · MACD · VWAP · Source: TradingView
Rank position
ranks 137th among the 175 sell signals for US stocks in our ranking, with a signal strength of 7 out of 100.
Sector context
SectorGrowth Tech
Benchmark ETFXLK
Sector regimein strong phase
Performanceweekly +1.80% · monthly +8.83%
APLD belongs to the growth tech sector (reference ETF XLK). The sector is classified in strong phase according to our weekly reading.
restricted Platinum content