
New Buy signal · week 1
Applied Materials jumps 11.3% and flips its signal from sell to buy
Our view last week
Applied Materials stock rose 9.1% with 92% of trading on the buy side: 7 days ago buyers already held 99% of volume while price slipped, and this time their push showed up on the chart. The price action shows a 5% rebound off the 20-day moving average. In our technical analysis of US stocks on sell signals, the short is still 4.5% in the money, down from 12.4% last week, and price is climbing back toward the Inversion Point, in the 494 area. A swing trading case to watch closely.
This week's summary
An 11.3% surge has turned the picture around: 7 days ago Applied Materials was still a Sell signal, and this week a new Buy signal fired. The price action printed a new 30-day high and money flow is back above zero after 6 weeks in negative territory. In our technical analysis of US stocks, Applied Materials stock joins the stocks with a fresh buy signal, though it calls for careful swing trading: the trigger, a close above the 547 area, has not come yet and volatility is elevated.
IQS Phase
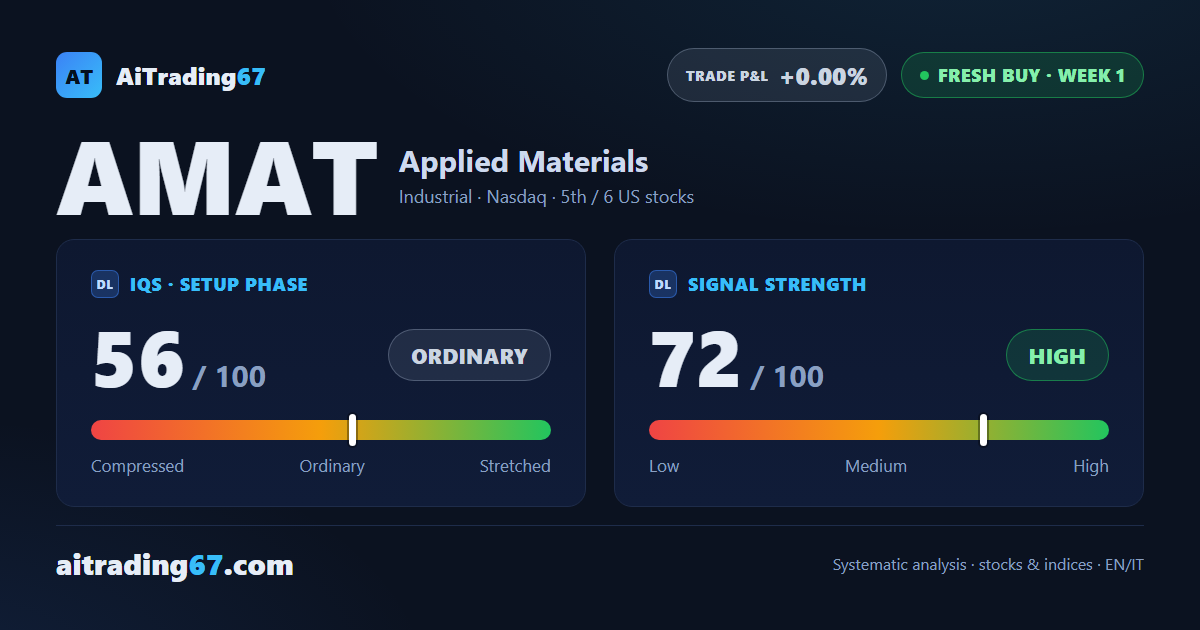
56
ordinary
Signal Strength
72
high · wide & volatile
Sizing
FULL
Ranking
#5 / 6
New us stocks
Trade P&L %
+0.00%
from signal to date, no stop loss
Applied Materials (AMAT) weekly chart — EMA50 · MACD · VWAP
Weekly chart · EMA50 · MACD · VWAP · Source: TradingView
Rank position
ranks 5th among the 6 fresh Longs for US stocks in our ranking, with a signal strength of 72 out of 100.
Sector context
SectorIndustrial
Benchmark ETFXLI
Sector regimeweak phase
Performanceweekly -0.28% · monthly -1.64%
AMAT belongs to the industrial sector (reference ETF XLI). The sector is classified weak phase according to our weekly reading.
restricted Platinum content