
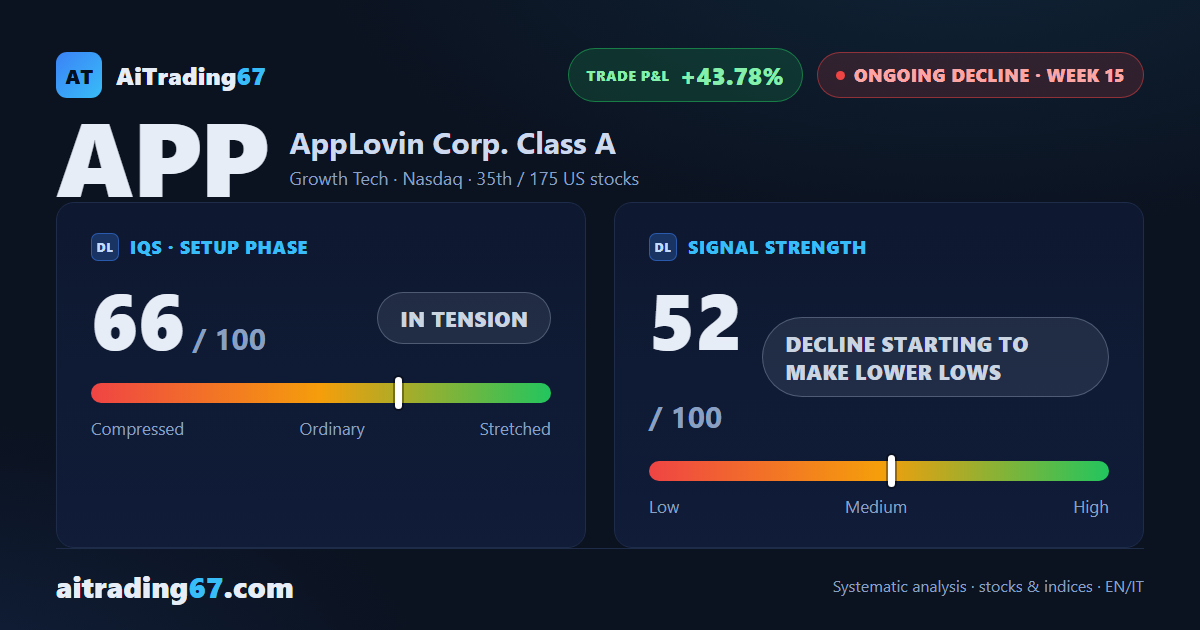
Sell signal · week 15 · US stocks
AppLovin drops 13.7% and loses its 200-week average, setting a fresh 30-week low
Our view last week
The 200-week average, in the 299 area, held again: AppLovin stopped just above it and bounced, closing the week up 0.9%. The rebound is hard to trust, because 81% of volume stayed on the sell side, after 99% the week before. For AppLovin stock, the technical analysis shows a decline that is slowing, with the MACD histogram rising for 5 weeks and money flow still negative. The sell signal stays live, a trade setup among US tech stocks with the short up 34.9%.
This week's summary
The 200-week average, which held a week ago, gave way this time: AppLovin loses 13.7% and sets a fresh 30-week low, confirmed on the weekly close. For AppLovin stock, the technical analysis shows a decline picking up pace again: the MACD histogram turns lower after 5 weeks of gains and money flow has been negative for 13. Among US tech stocks the sell signal stays live, with the short up 43.8%; on the daily chart the RSI at 28 is oversold.
IQS Phase
66
in tension
Signal Strength
52
decline starting to make lower lows
Sizing
STANDARD
Ranking
#35 / 175
US stocks
Trade P&L %
+43.78%
from signal to date, no stop loss
AppLovin (APP) weekly chart — EMA50 · MACD · VWAP
Weekly chart · EMA50 · MACD · VWAP · Source: TradingView
Rank position
ranks 35th among the 175 sell signals for US stocks in our ranking, with a signal strength of 52 out of 100.
Sector context
SectorGrowth Tech
Benchmark ETFXLK
Sector regimein strong phase
Performanceweekly +1.80% · monthly +8.83%
APP belongs to the growth tech sector (reference ETF XLK). The sector is classified in strong phase according to our weekly reading.
restricted Platinum content