
New Sell signal · EU-UK stocks
Generali drops 5.2% and a Sell signal fires as the stock sets a fresh 30-day low
Our view last week
For a second straight week sellers took the weekly bar on Generali stock, and this time the price followed them: down 3.4%, with 71% of volume on the sell side. The weekly MACD slipped below its signal line after 23 weeks and the RSI fell from 71.4 to 61.2. Money flow is still positive, though it has been slowing for 3 weeks. The long trade stands 21.8% up from entry: a swing trading case to watch closely through its price action.
This week's summary
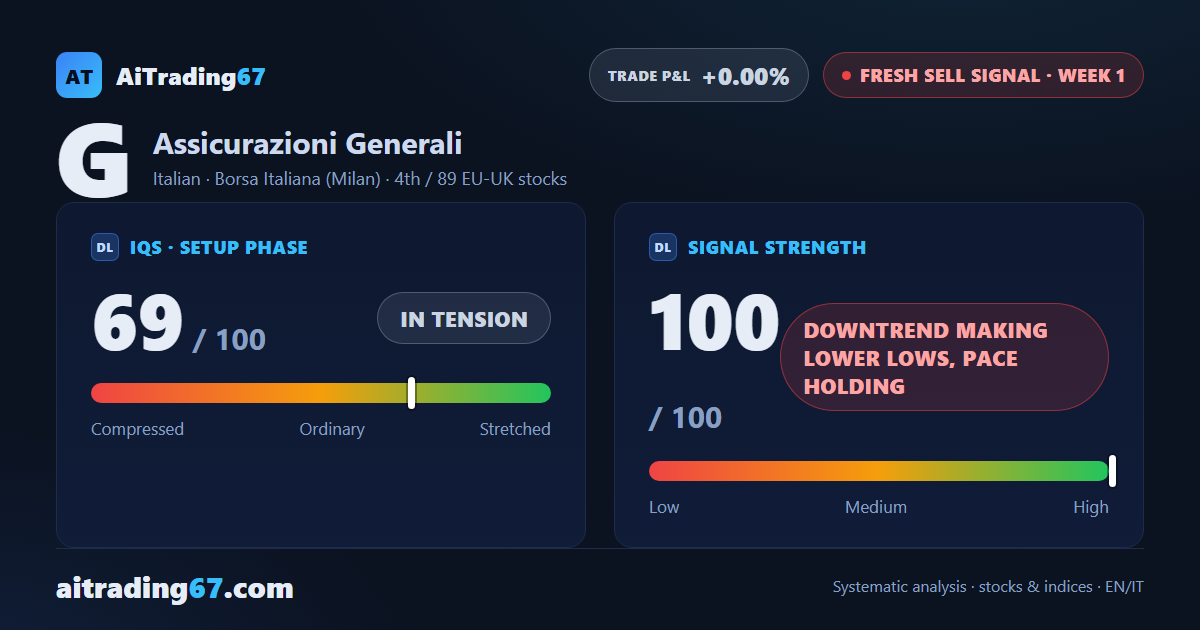
A 5.2% drop takes Generali to a fresh 30-day low and triggers a new Sell signal, a week after the weekly MACD slipped below its signal line. The decline is holding its pace: Signal Strength stands at 100 out of 100. Generali stock is still 39% above its 200-week average, though, and our model rates a new short here as high-risk: a swing trading case among Italian stocks, with the confirmation week still open.
IQS Phase
69
in tension
Signal Strength
100
downtrend making lower lows, pace holding
Sizing
STANDARD
Ranking
#4 / 89
New eu-uk stocks
Trade P&L %
+0.00%
from signal to date, no stop loss
Assicurazioni Generali (G) weekly chart — EMA50 · MACD · VWAP
Weekly chart · EMA50 · MACD · VWAP · Source: TradingView
Rank position
ranks 4th among the 89 sell signals for European-UK stocks in our ranking, with a signal strength of 100 out of 100.
Sector context
SectorItalian
Benchmark ETFEXV1
Sector regimeweak phase
Performanceweekly -4.91% · monthly -4.92%
G belongs to the italian sector (reference ETF EXV1). The sector is classified weak phase according to our weekly reading.
restricted Platinum content