
Sell signal · week 17 · US stocks
AST SpaceMobile drops 5.4% and breaks its run of higher lows on the daily chart
Our view last week
After two down weeks, AST SpaceMobile stock bounces 5.6% and sellers, at 81% of volume a week ago, drop to 51%. The recovery stalls below the 50-day average, in the 65 area, and on the weekly chart MACD and money flow stay negative. The technical analysis shows a decline that is slowing, with 5 higher lows in the daily price action. The sell signal still holds on one of the US stocks we track, with the short 25% in profit.
This week's summary
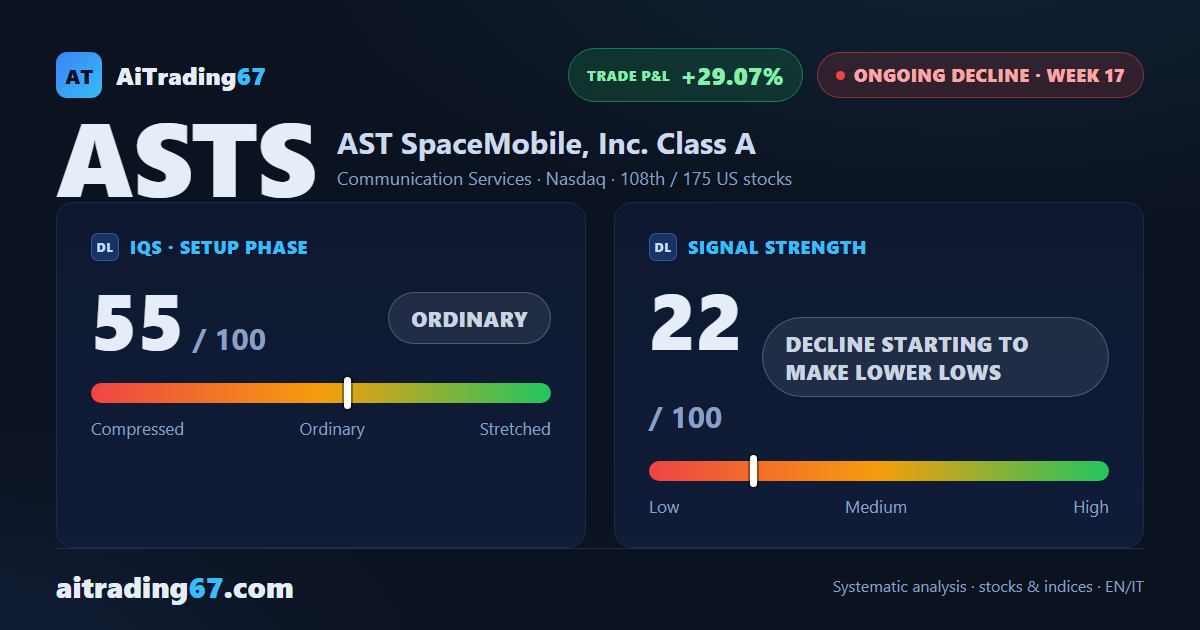
The run of 5 higher lows on the daily chart has broken and AST SpaceMobile stock drops 5.4%, handing back last week's bounce. The recovery stalled again at the 50-day moving average, in the 64 area, and price is back below its 100-week average. The weekly technical analysis shows MACD below its Signal line and money flow still negative, though the histogram and the flow have been rising for weeks. Among US stocks the sell signal holds, with the short 29% in profit.
IQS Phase
55
ordinary
Signal Strength
22
decline starting to make lower lows
Sizing
MINIMUM
Ranking
#108 / 175
US stocks
Trade P&L %
+29.07%
from signal to date, no stop loss
AST SpaceMobile (ASTS) weekly chart — EMA50 · MACD · VWAP
Weekly chart · EMA50 · MACD · VWAP · Source: TradingView
Rank position
ranks 108th among the 175 sell signals for US stocks in our ranking, with a signal strength of 22 out of 100.
Sector context
SectorCommunication Services
Benchmark ETFXLC
Sector regimein positive regime
Performanceweekly -2.34% · monthly -1.87%
ASTS belongs to the communication services sector (reference ETF XLC). The sector is classified in positive regime according to our weekly reading.
restricted Platinum content