
Sell signal, week 12: the decline resumes
AstraZeneca drops 5.4% as the rebound stalls under the 100-week average
Our view last week
After last week's 6.8% jump, AstraZeneca stock pauses at +0.4%: the price action shows an indecisive weekly bar, while buyers hold 63% of trading and money flow stays positive. On the technical analysis the decline is losing its grip. The close and the Inversion Point, in the 12530 area, have already crossed with no change of sign declared: one to watch in the coming sessions.
This week's summary
AstraZeneca's rebound broke against the 100-week moving average, in the 12545 area: the week closed down 5.4%, wiping out most of mid-September's jump. A week ago the decline seemed to be losing its grip; now it is back in stride, and the weekly price action shows a distribution phase. On the technical analysis of AstraZeneca stock, money flow turns negative again and the RSI slips to 41. For swing trading, support is close: the 200-week average, in the 11710 area.
IQS Phase
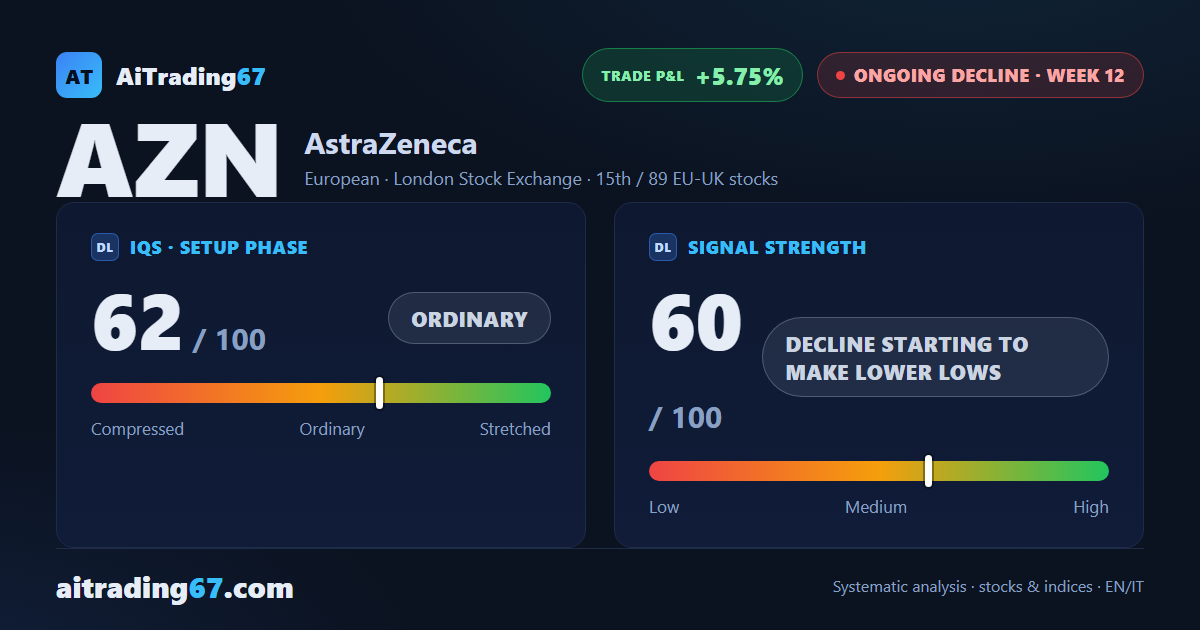
62
ordinary
Signal Strength
60
decline starting to make lower lows
Sizing
STANDARD
Ranking
#15 / 89
EU-UK stocks
Trade P&L %
+5.75%
from signal to date, no stop loss
AstraZeneca (AZN) weekly chart — EMA50 · MACD · VWAP
Weekly chart · EMA50 · MACD · VWAP · Source: TradingView
Rank position
ranks 15th among the 89 sell signals for European-UK stocks in our ranking, with a signal strength of 60 out of 100.
Sector context
SectorEuropean
Benchmark ETFEXV4
Sector regimeweak phase
Performanceweekly -2.52% · monthly -5.64%
AZN belongs to the european sector (reference ETF EXV4). The sector is classified weak phase according to our weekly reading.
restricted Platinum content