EN IT

AST SpaceMobile: weekly chart turns bearish, but risk level is high

AST SpaceMobile — week 1 of a fresh sell signal: bearish weekly structure, lower highs in sequence on the daily chart, but the stock still trades 104% above the 200-week moving average. Technical analysis flags elevated risk: trading not recommended per our model.

AST SpaceMobile: weekly chart turns bearish, but risk level is high
Fresh sell signal — AST SpaceMobile
AST SpaceMobile: weekly chart turns bearish, but risk level is high
June 19, 2026
Fresh sell signal — AST SpaceMobile
In Summary
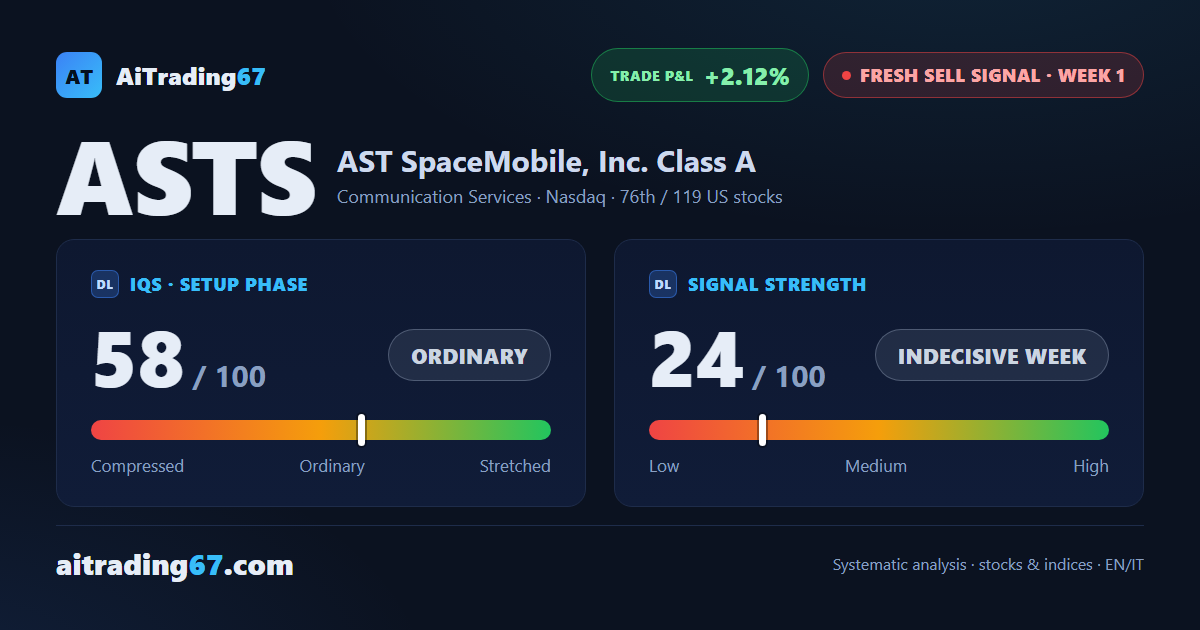
AST SpaceMobile receives a fresh weekly sell signal. The structure is intermediate bearish, with 4 lower highs in sequence on the daily chart from the 134 area down to the 98 area. The setup quality indicator stands at 58 out of 100 in ordinary phase, signal strength at 24 — an indecisive week, not an acceleration. The quality band flags trading not recommended: the stock still trades more than 104% above the 200-week moving average.
Fresh sell signal ·1st week from start ·US stocks ·T2 ★ See Gold version →
IQS Phase
58
ordinary
Signal Strength
24
indecisive week
Sizing
MINIMUM
Ranking
#76 / 119
New us stocks
Trade P&L %
+2.12%
from signal to today
Chart · Weekly — EMA50 · MACD · VWAP
Weekly chart · EMA50 · MACD · VWAP · Source: TradingView
How to read this pageA visual guide to the post, card by card
The full analysis, operating plan and detailed levels on this asset are reserved for clients ★ PLATINUM
restricted Platinum content
Share WhatsApp Telegram Gmail LinkedIn