
Broadcom: an 11% bounce the flows aren't buying yet
Broadcom jumps 11% this week, but the flows aren't confirming the bounce
Broadcom: an 11% bounce the flows aren't buying yet
Our view last week
Broadcom is in week 4 of a sell signal: the stock lost 1.3% on the week, the weekly structure stays mildly bearish, and the setup quality indicator has climbed to 83 out of 100, in a tension/maturity phase. The stock ranks 13th among the 137 US sell signals, but it's still 64.9% above its 200-week average — our quality band flags elevated risk for a new short.
This week's summary
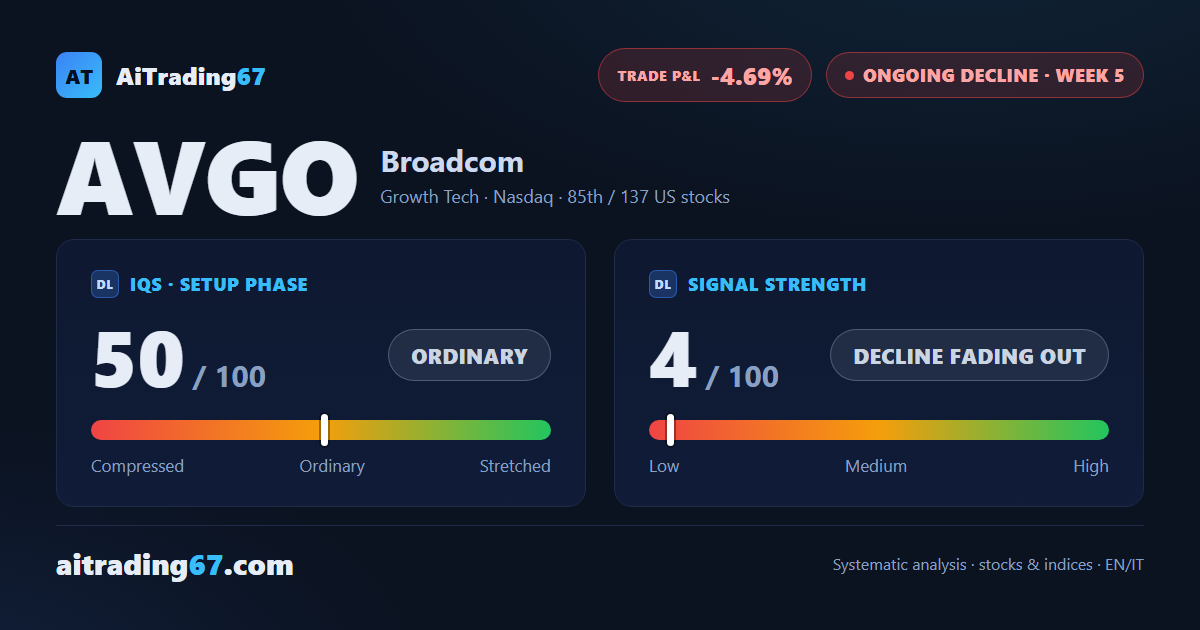
Broadcom closed the week with an 11% surge, the bounce off a daily double bottom in the 361 area, backed by a sharp volume shift toward buyers. But money flow stays negative and distribution hasn't stopped: in this week's Broadcom technical analysis, the rally isn't confirmed yet. The Sell signal is in its 5th week, and price is now pressing against the key-level band, where the next move gets decided.
IQS Phase
50
ordinary
Signal Strength
4
decline fading out
Sizing
MINIMUM
Ranking
#85 / 137
US stocks
Trade P&L %
-4.69%
from signal to today
restricted Platinum content