
Broadcom's bounce fades: down 7.3% this week
Broadcom drops 7.3% as the sell signal tightens its grip again
Broadcom's bounce fades: down 7.3% this week
Our view last week
Broadcom closed the week with an 11% surge, the bounce off a daily double bottom in the 361 area, backed by a sharp volume shift toward buyers. But money flow stays negative and distribution hasn't stopped: in this week's Broadcom technical analysis, the rally isn't confirmed yet. The Sell signal is in its 5th week, and price is now pressing against the key-level band, where the next move gets decided.
This week's summary
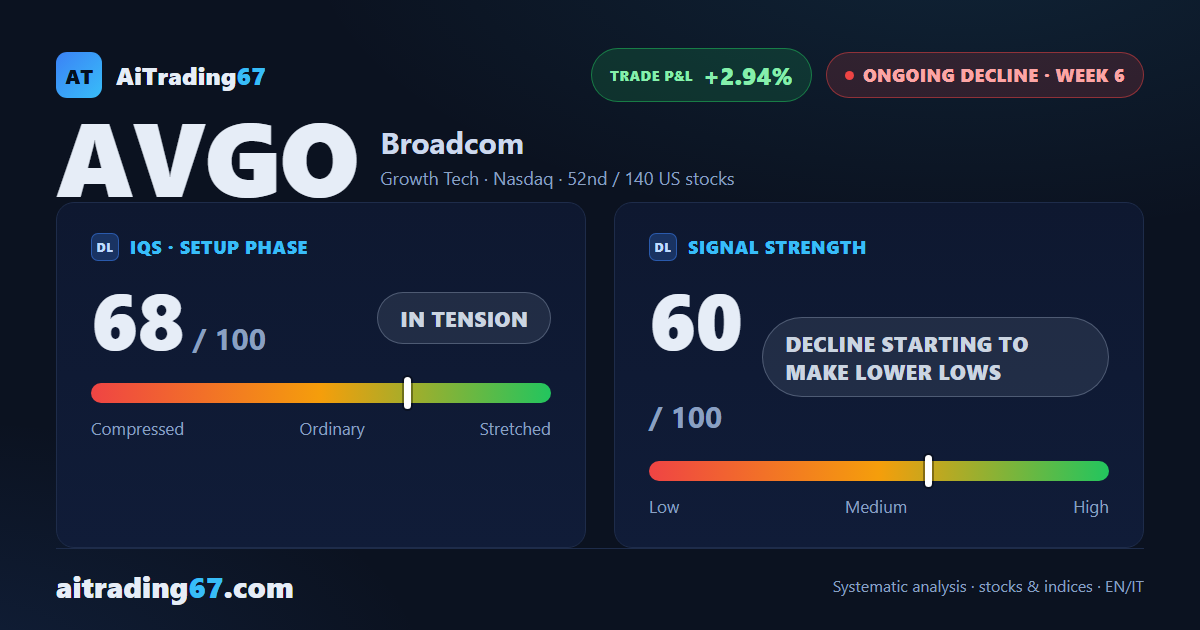
Broadcom gave back most of last week's rebound: after an 11% bounce, the stock drops 7.3% this week and money flow worsens again, with sellers making up 68% of volume. The sell signal has been under management for six weeks, the short in modest profit; price is now working between the 20-week average, in the 380 area, and the daily pivot support, in the 369 area.
IQS Phase
68
in tension
Signal Strength
60
decline starting to make lower lows
Sizing
STANDARD
Ranking
#52 / 140
US stocks
Trade P&L %
+2.94%
from signal to today
restricted Platinum content