
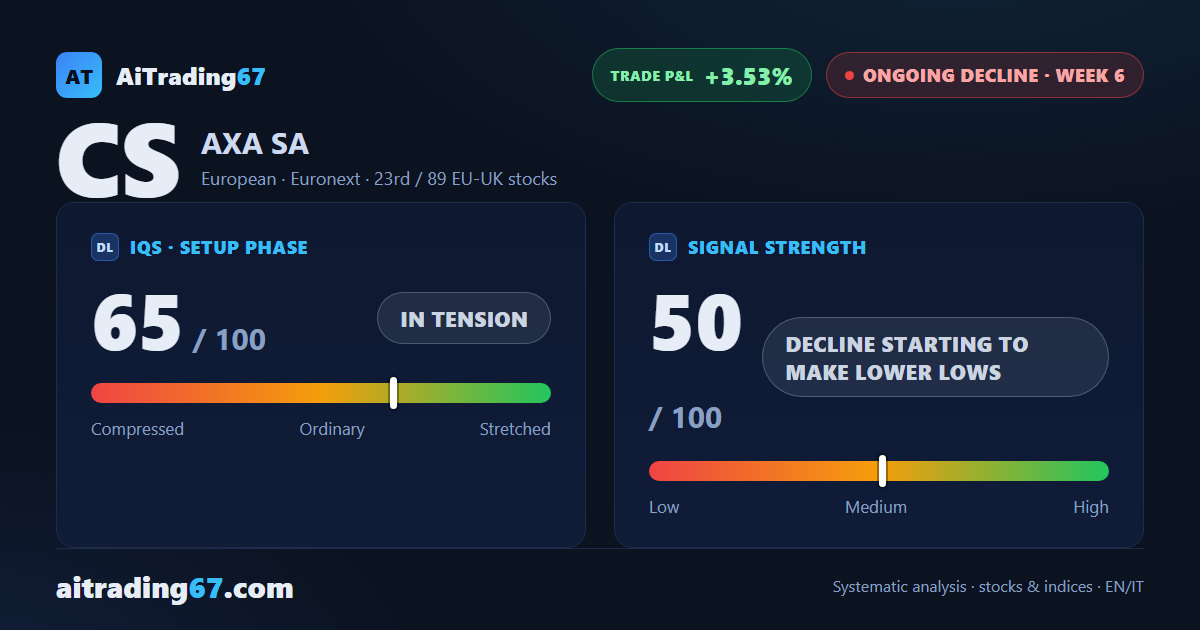
Sell signal · week 6
AXA drops 4.4% and loses its short-term averages: the 50-week average holds
Our view last week
AXA stock slips 1.6%, handing back part of last week's rebound, yet on the daily chart the 20-day moving average, in the 44 area, halted the slide once again. The technical analysis shows a sell-side trade setup struggling to gain traction: the weekly MACD stays below its signal line, money flow is cooling but still positive, and the price action has the stock squeezed between the daily Kumo ceiling and the short-term averages.
This week's summary
The 20-day moving average that halted the slide a week ago has now given way: AXA stock drops 4.4%, falls below its short-term averages and sets a new 30-day low. The weekly technical analysis shows the MACD pulling further away from its signal line and the RSI slipping to 47, while daily price action traces 3 lower highs. The 50-week average, in the 41.7 area, held on the close: that is where this sell-side trade setup plays its next move.
IQS Phase
65
in tension
Signal Strength
50
decline starting to make lower lows
Sizing
STANDARD
Ranking
#23 / 89
EU-UK stocks
Trade P&L %
+3.53%
from signal to date, no stop loss
AXA (CS) weekly chart — EMA50 · MACD · VWAP
Weekly chart · EMA50 · MACD · VWAP · Source: TradingView
Rank position
ranks 23rd among the 89 sell signals for European-UK stocks in our ranking, with a signal strength of 50 out of 100.
Sector context
SectorEuropean
Benchmark ETFEXV1
Sector regimeweak phase
Performanceweekly -4.91% · monthly -4.92%
CS belongs to the european sector (reference ETF EXV1). The sector is classified weak phase according to our weekly reading.
restricted Platinum content