
Open buy: dynamic stop already near breakeven
Azimut slips 0.4% for the week, but bounces 4% off its double bottom in the 34 area
Open buy: dynamic stop already near breakeven
Our view last week
Azimut Holding is in week 2 of a buy signal, but the confirmation week closed lower: signal strength drops to 32 out of 100. The stock ranks 57th among the 62 Longs already running for European-UK stocks, with the weekly structure still bullish underneath but a few short-term warnings building. Earnings are due in three-four weeks.
This week's summary
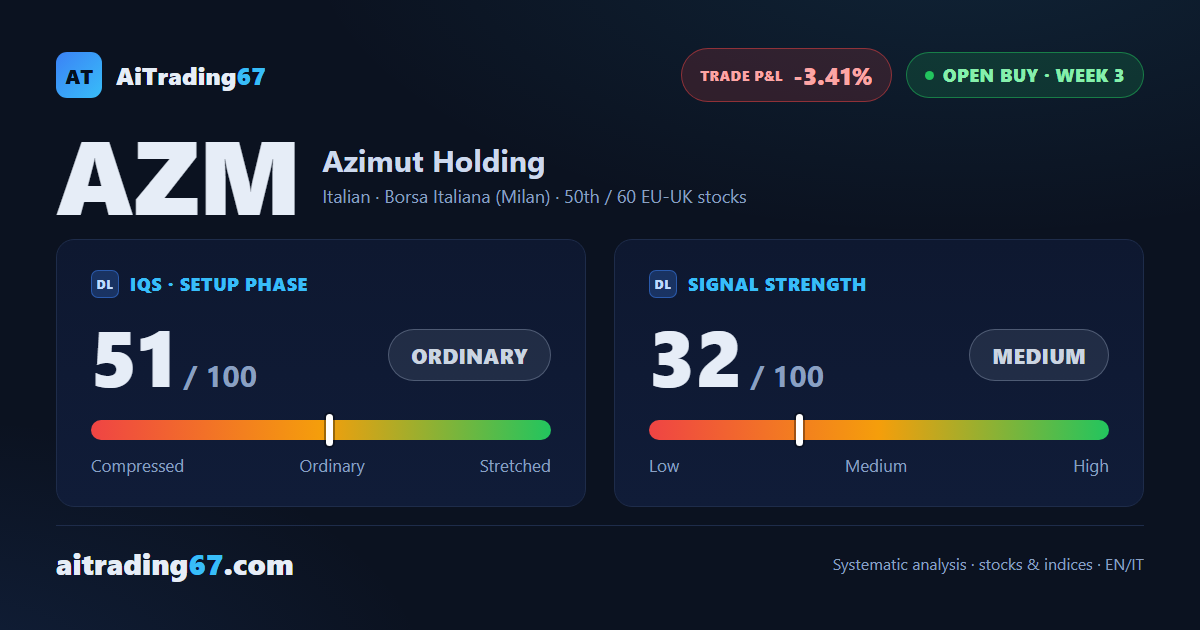
In this week's technical picture, Azimut carves out a clean double bottom in the 34 area: a 4% bounce with buyers running 94.7% of the session's volume. The weekly picture stays more cautious — down 0.4%, volumes contracting, a distribution phase underway. After last week's negative confirmation, the dynamic stop has already tightened to near breakeven: the trade stays under watch.
IQS Phase
51
ordinary
Signal Strength
32
medium · weak
Sizing
REDUCED
Ranking
#50 / 60
EU-UK stocks in progress
Trade P&L %
-3.41%
from signal to today
restricted Platinum content