
Buy signal loses steam in its fourth week
Azimut slips 1.1%: the buy signal cools off in week 4
Buy signal loses steam in its fourth week
Our view last week
In this week's technical picture, Azimut carves out a clean double bottom in the 34 area: a 4% bounce with buyers running 94.7% of the session's volume. The weekly picture stays more cautious — down 0.4%, volumes contracting, a distribution phase underway. After last week's negative confirmation, the dynamic stop has already tightened to near breakeven: the trade stays under watch.
This week's summary
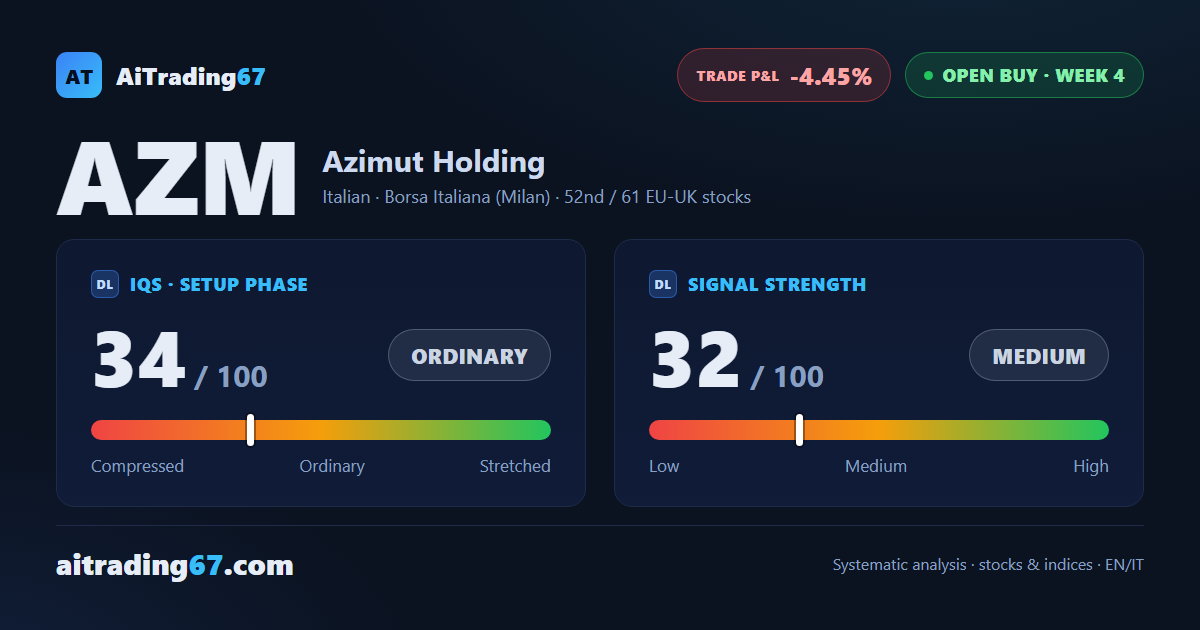
Azimut stock stays boxed into a tight range: after last week's clean double bottom in the 35 area, this week the stock slips 1.1% and sellers edge back into control. Distribution stays underway, and the buy signal, now in its fourth week, is starting to lose its footing — signal strength drops to 32 out of 100. In this swing trading picture, price remains squeezed between support in the 35.8 area and resistance in the 35.9 area.
IQS Phase
34
ordinary
Signal Strength
32
medium · weak
Sizing
REDUCED
Ranking
#52 / 61
EU-UK stocks in progress
Trade P&L %
-4.45%
from signal to today
restricted Platinum content