
Barrick Mining — new sell signal
Barrick Mining: sell signal triggers above the 200-week moving average
Barrick Mining — new sell signal
In Summary
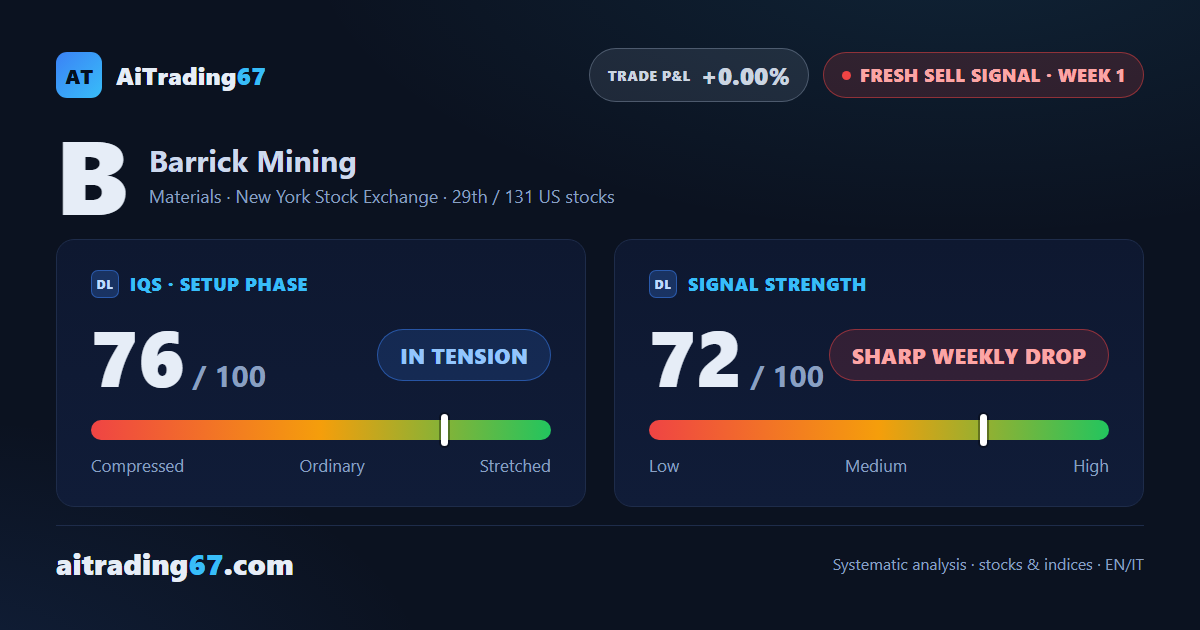
Barrick Mining enters week 1 of a new sell signal, ranking 29th among 131 sell signals for US stocks. The setup quality indicator stands at 76 out of 100, in a tension phase; signal strength at 72 reflects a wide weekly drop — but that very amplitude calls for caution, reading it as possible exhaustion rather than trend confirmation. The quality band flags trading not recommended, with the stock still 41% above its 200-week moving average.
IQS Phase
76
in tension
Signal Strength
72
sharp weekly drop · exhaustion risk
Sizing
STANDARD
Ranking
#29 / 131
New us stocks
Trade P&L %
+0.00%
from signal to today
restricted Platinum content