Alibaba · sell signal, week 2
Alibaba declining: signal holds, but the double bottom demands attention
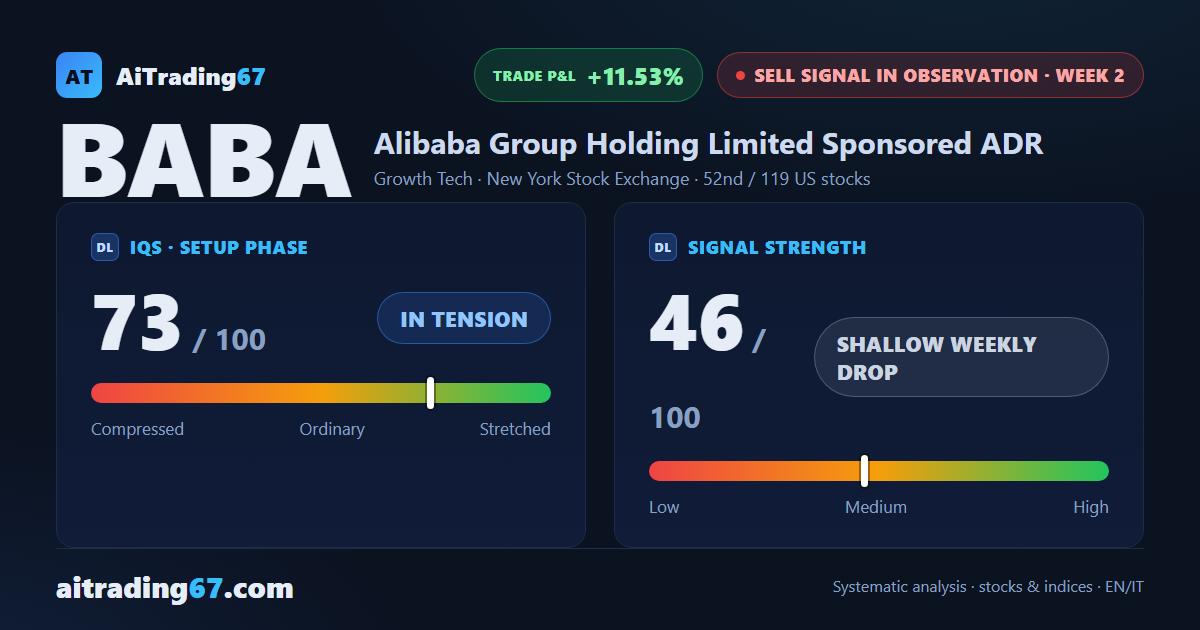
Alibaba · sell signal, week 2
In Summary
Alibaba is in week 2 of a sell signal, with the trade showing a +11.5% gain since inception. The weekly structure remains bearish and the confirmation week closed lower: discipline suggests keeping the existing short position unchanged. On the daily chart, however, a double bottom is forming in the 108 area with an intermediate rebound of 8%: a detail that does not alter the weekly picture, but one worth reading before any new move.
IQS Phase
73
in tension
Signal Strength
46
shallow weekly drop
Sizing
REDUCED
Ranking
#52 / 119
US stocks sell signals
Trade P&L %
+11.53%
from signal to today
restricted Platinum content