
Sell signal, week 3: the lows under test
Banca Mediolanum slips 0.3%, back at lows in the 23 area that no session has defended yet
Our view last week
Sellers dominated Banca Mediolanum's weekly bar on shrinking volume, and the stock closed flat after being turned back in the 24 area. Banca Mediolanum stock stays on the Sell signal that kicked in a week ago, yet the technical analysis trims its weight: signal strength slumps from 17 to 2 out of 100, a decline losing steam, while money flow has been positive for 23 weeks.
This week's summary
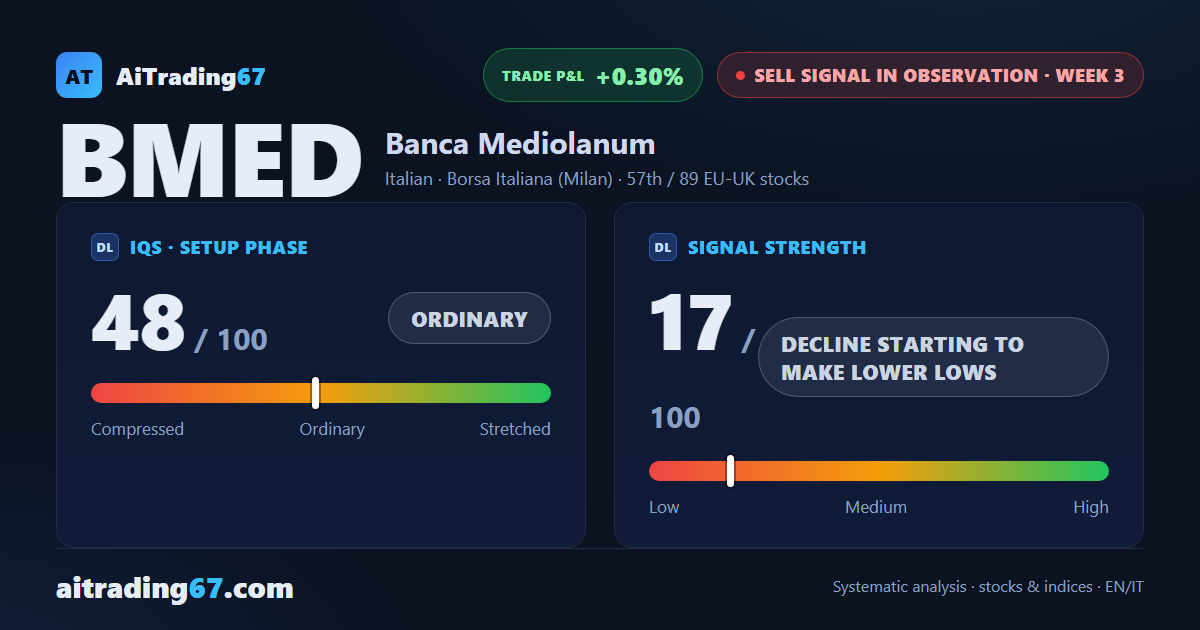
A near-flat week for Banca Mediolanum, down 0.3%, yet it closed in the lower part of its range and back at its lows in the 23 area, the same as mid-September: daily price action shows no session has defended them so far. Banca Mediolanum stock stays on its Sell signal. Last week the decline looked out of steam, now it is making lower lows, with money flow weakening. The bigger picture still holds: on our model, opening a short here is high-risk.
IQS Phase
48
ordinary
Signal Strength
17
decline starting to make lower lows
Sizing
MINIMUM
Ranking
#57 / 89
EU-UK stocks sell signals
Trade P&L %
+0.30%
from signal to date, no stop loss
Banca Mediolanum (BMED) weekly chart — EMA50 · MACD · VWAP
Weekly chart · EMA50 · MACD · VWAP · Source: TradingView
Rank position
ranks 57th among the 89 sell signals for European-UK stocks in our ranking, with a signal strength of 17 out of 100.
Sector context
SectorItalian
Benchmark ETFEXV1
Sector regimeweak phase
Performanceweekly -4.91% · monthly -4.92%
BMED belongs to the italian sector (reference ETF EXV1). The sector is classified weak phase according to our weekly reading.
restricted Platinum content