
Barclays dips 1.9%: sellers take the first round
Barclays dips 1.9% as sellers show up after three straight weeks of gains
Barclays dips 1.9%: sellers take the first round
Our view last week
Model coverage on Barclays is complete: all 3 statistical references have been hit, and the residual capital keeps running at +18.44% performance since entry. The stop now follows the Inversion Point, in the 483.8 area, protecting the accumulated gain. On the technical side, the week just closed confirms the climb, with one single warning on buyer participation.
This week's summary
The buyer-participation warning from a week ago has shown up: this week sellers outweighed buyers for the first time (53% versus 47%) and Barclays dipped 1.9%, after three straight weeks of gains. The weekly MACD histogram is easing off, but money flow stays solidly positive and the ADX keeps climbing: the trend still holds its conviction. Price remains capped under the 532 area, already tested four times since early April without ever clearing it.
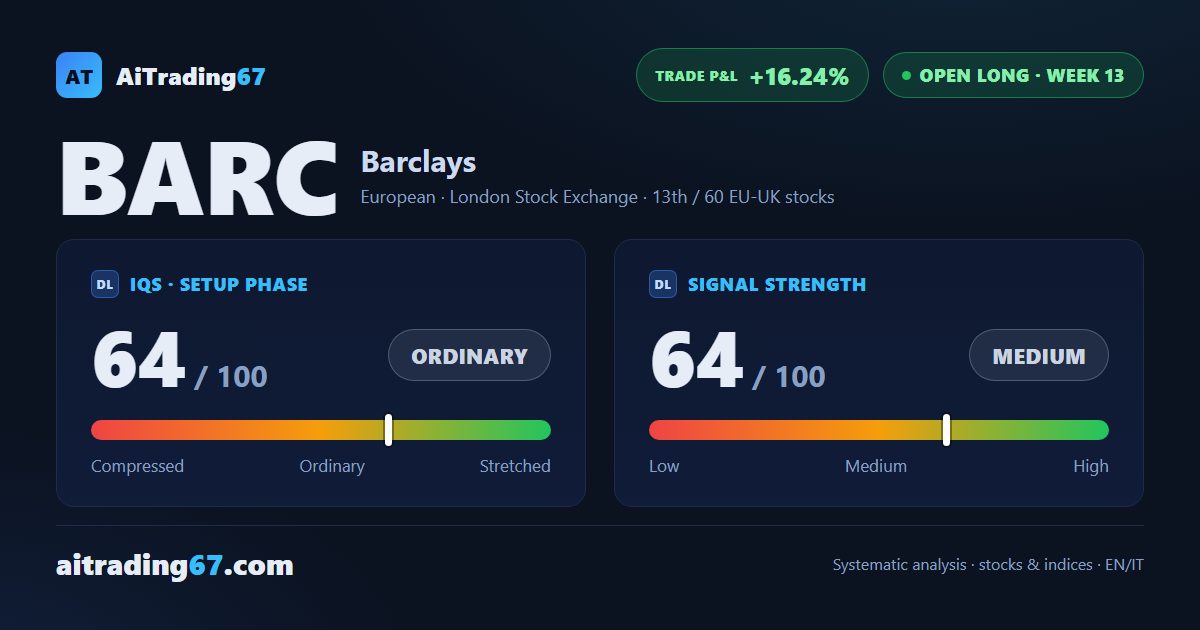
IQS Phase
64
ordinary
Signal Strength
64
medium
Sizing
STANDARD
Ranking
#13 / 60
EU-UK stocks in progress
Trade P&L %
+16.24%
from signal to today
restricted Platinum content