
New sell signal · US stocks
Barrick Mining drops 6.2%: a new sell signal lands on the 200-day average
Our view last week
On the daily chart Barrick Mining stock touched the 41 area and bounced 4% off its 50-day average, with 92% of daily volume on the buy side. The week still closed 1% lower, its 5th straight decline, and the weekly MACD keeps losing momentum. Among weekly buy signals on US stocks this one holds: price action is now boxed between the 20-day average, in the 43.3 area, and support in the 42.6 area, a narrow lane that swing trading readers will watch closely.
This week's summary
The narrow lane that was propping up the buy signal 7 days ago has given way: Barrick Mining stock lost 6.2%, its 6th straight weekly decline, printed a new 30-day low and triggered a new Sell signal. Price action stalled on the 200-day moving average, in the 40 area, touched and defended on the close. On technical analysis the decline is keeping its pace, yet price rests on a cluster of supports: among US stocks, a swing trading case with little room to chase.
IQS Phase
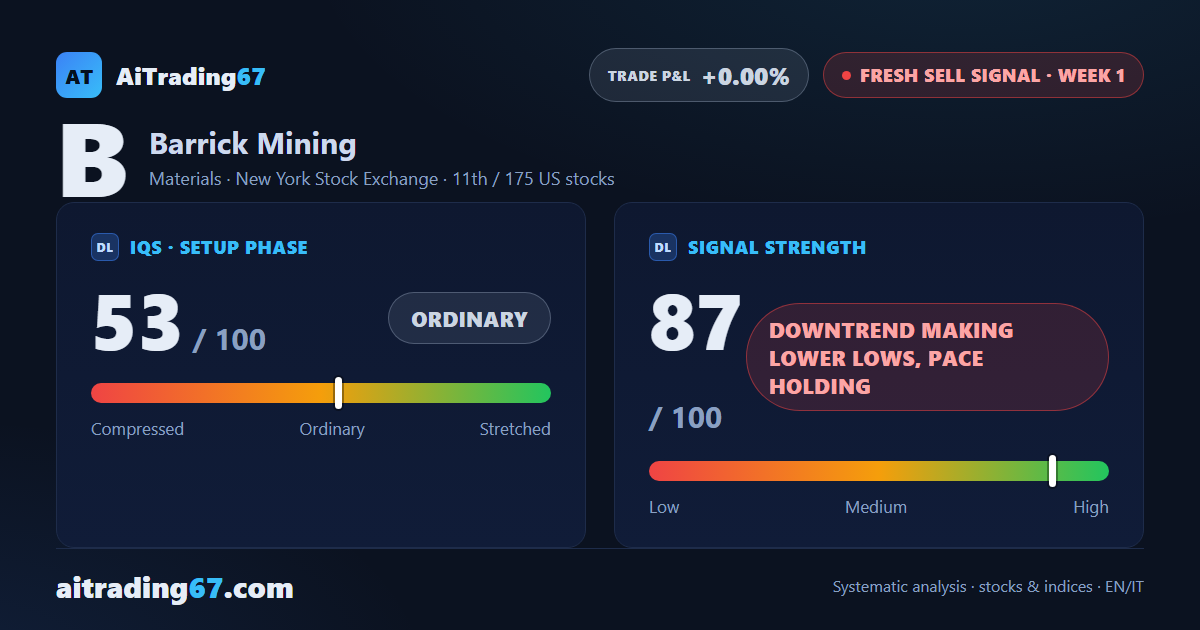
53
ordinary
Signal Strength
87
downtrend making lower lows, pace holding
Sizing
STANDARD
Ranking
#11 / 175
New us stocks
Trade P&L %
+0.00%
from signal to date, no stop loss
Barrick Mining (B) weekly chart — EMA50 · MACD · VWAP
Weekly chart · EMA50 · MACD · VWAP · Source: TradingView
Rank position
ranks 11th among the 175 sell signals for US stocks in our ranking, with a signal strength of 87 out of 100.
Sector context
SectorMaterials
Benchmark ETFXLB
Sector regimeweak phase
Performanceweekly -1.89% · monthly -7.72%
B belongs to the materials sector (reference ETF XLB). The sector is classified weak phase according to our weekly reading.
restricted Platinum content