
BASF: Sell signal in management, picture stays mixed
BASF slips 0.5%: the Sell signal stays pinned between two technical walls
BASF: Sell signal in management, picture stays mixed
Our view last week
BASF is in week 5 of a sell signal, ranking 6th among the 54 European sell signals. Signal strength has dropped to 12 out of 100: the decline holds but has lost fresh momentum. The three observation weeks closed sideways, with no market confirmation of the exit. Trading not recommended per our model.
This week's summary
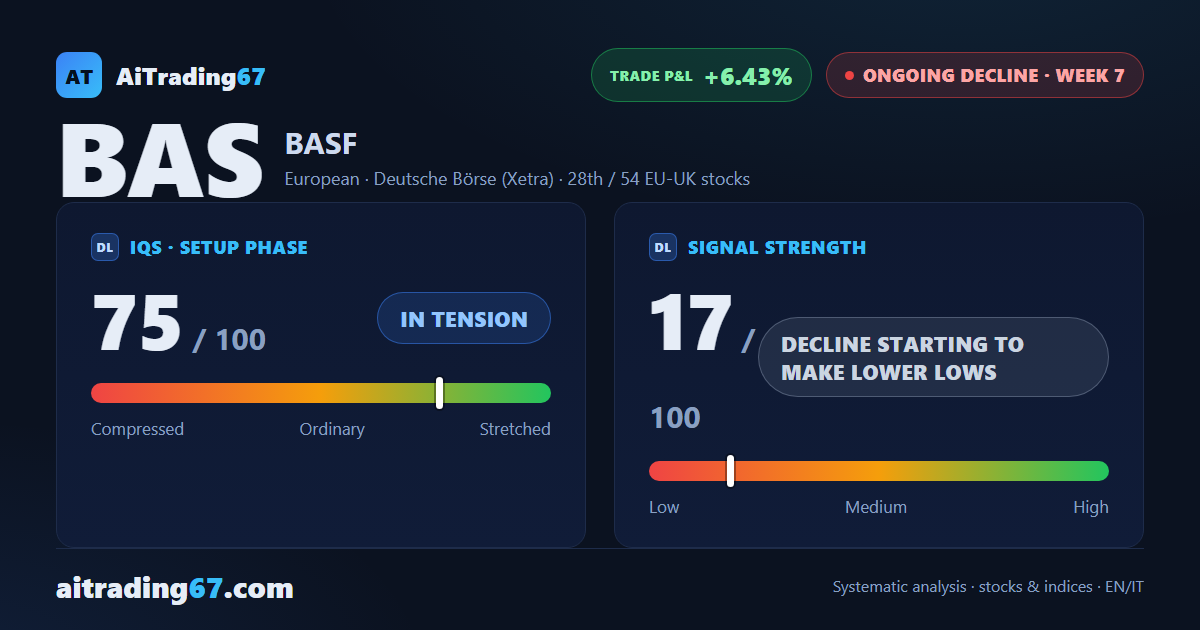
Money flow on BASF turned sharply worse this week, with sellers regaining a slight edge after a calmer stretch. The Sell signal, under management for seven weeks and already up 6.43%, stays boxed into a tight corridor between the 47.6 and 46.7 areas, while a daily double bottom in the 47 area keeps the rebound case alive. Weekly technical analysis of a decline still stalling.
IQS Phase
75
in tension
Signal Strength
17
decline starting to make lower lows
Sizing
MINIMUM
Ranking
#28 / 54
EU-UK stocks
Trade P&L %
+6.43%
from signal to today
restricted Platinum content