
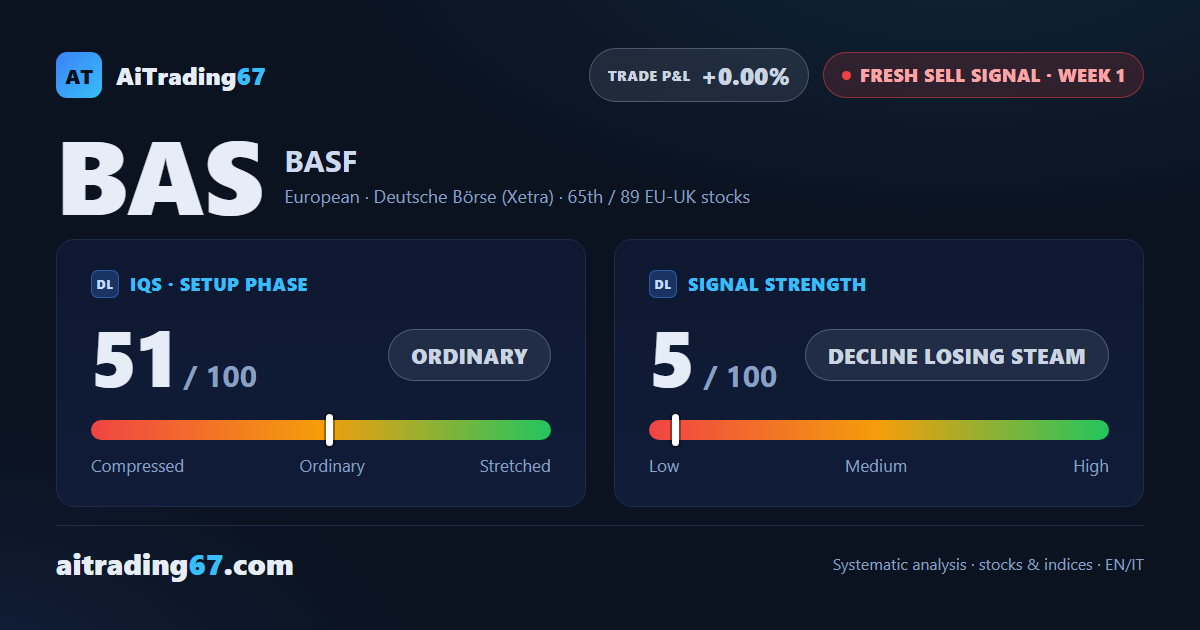
BASF · new sell signal, a decline short on push
BASF slips 1% in a fourth straight down week: the Sell signal arrives, at a slow pace
Our view last week
A third straight down week for BASF stock: -2.3%, with sellers extremely dominant in the weekly bar and the weekly MACD slipping below its Signal line. Last week's slowdown didn't hold, and the price action now weighs. Price still sits above the 50-week average, with the trade back at entry levels. Price closed below the first stop level (SL1) flagged in last week's card (50.89 area): for anyone following that level the trade is closed. The close and the Inversion Point, which matches SL1, have already crossed with no change of sign declared: one to watch in the coming sessions.
This week's summary
The change of sign that was in the air last week has arrived: a new Sell signal is triggered on BASF, at the end of a fourth straight down week (-1%). In the weekly technical analysis, though, BASF stock shows a decline that starts out short of breath: signal strength at 5 out of 100, an ADX falling for 4 weeks, indecisive price action and price still above its 50-week average. A trade setup to follow among European stocks, with a new short not recommended.
IQS Phase
51
ordinary
Signal Strength
5
decline losing steam
Sizing
MINIMUM
Ranking
#65 / 89
New eu-uk stocks
Trade P&L %
+0.00%
from signal to date, no stop loss
BASF (BAS) weekly chart — EMA50 · MACD · VWAP
Weekly chart · EMA50 · MACD · VWAP · Source: TradingView
Rank position
ranks 65th among the 89 sell signals for European-UK stocks in our ranking, with a signal strength of 5 out of 100.
Sector context
SectorEuropean
Benchmark ETFEXV6
Sector regimeweak phase
Performanceweekly -0.36% · monthly -4.97%
BAS belongs to the european sector (reference ETF EXV6). The sector is classified weak phase according to our weekly reading.
restricted Platinum content